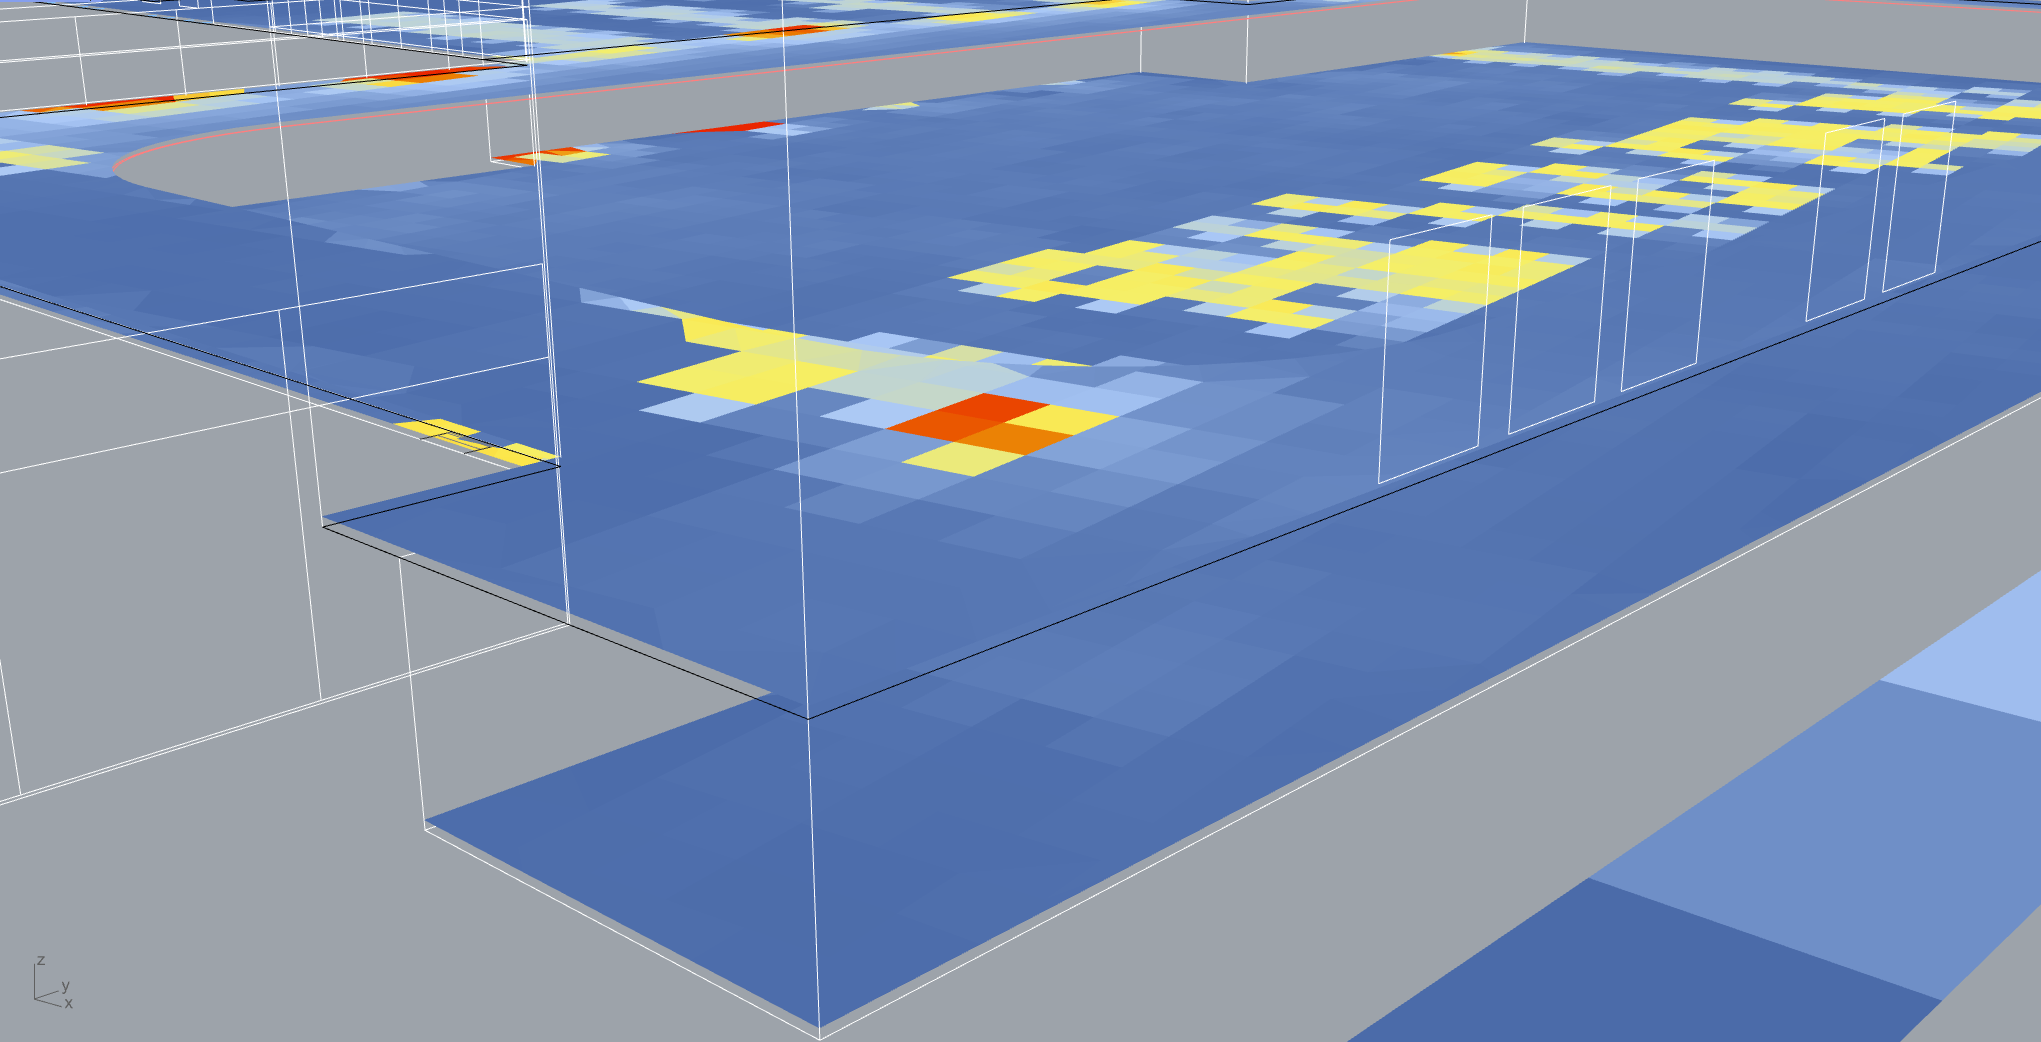
The daylight heatmap visuals in GH is separated from the sensor grid by -0.7m, not really too major but it is strange it is negative when it is moving upwards rather than positive. Also even though we have skylights showing on this image, the east windows pictured in white lines here aren’t showing the effects of daylight on the analysis plane (there’s a ground level with center cutout for a walking track and basement level).
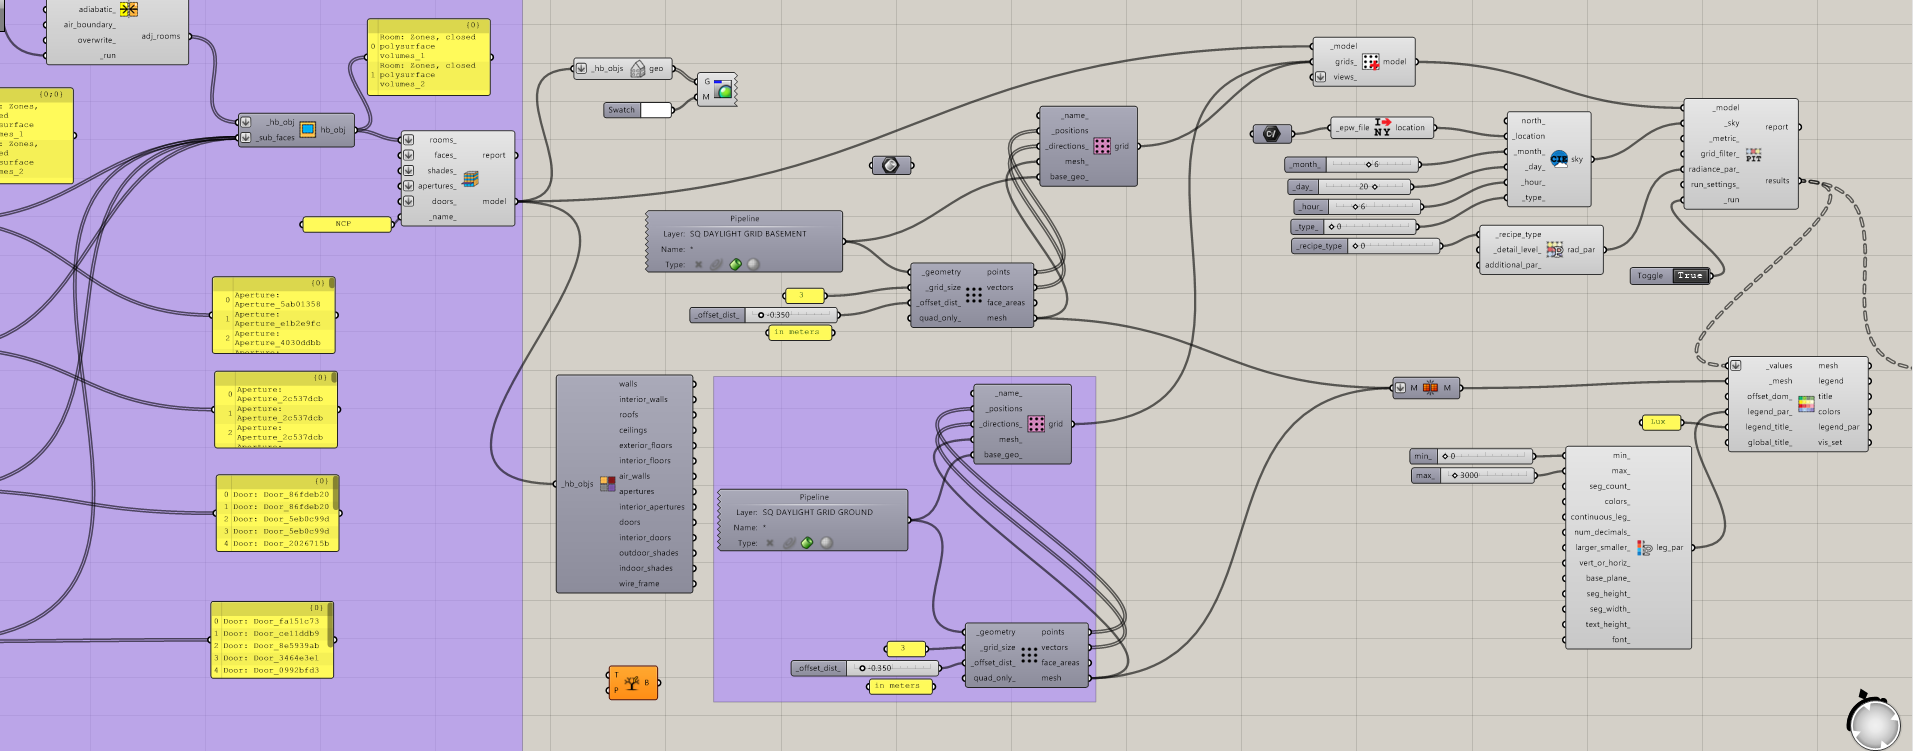
Side note: Is there a better way to merge multiple heatmaps into one input? I originally had them both in the same geometry pipeline layer, but had to separate the different levels into 2 layers and connect. Can show image if you’d like
A copy of the model or an image of the preview visualisation (viz by type) would be useful.
At a guess your grid surfaces are facing down instead of up, you can use the Dir command in Rhino to check.
It looks like you’re building your model from Rooms, so you might have more success using the Grid from Rooms component than building the grids from separately defined surfaces
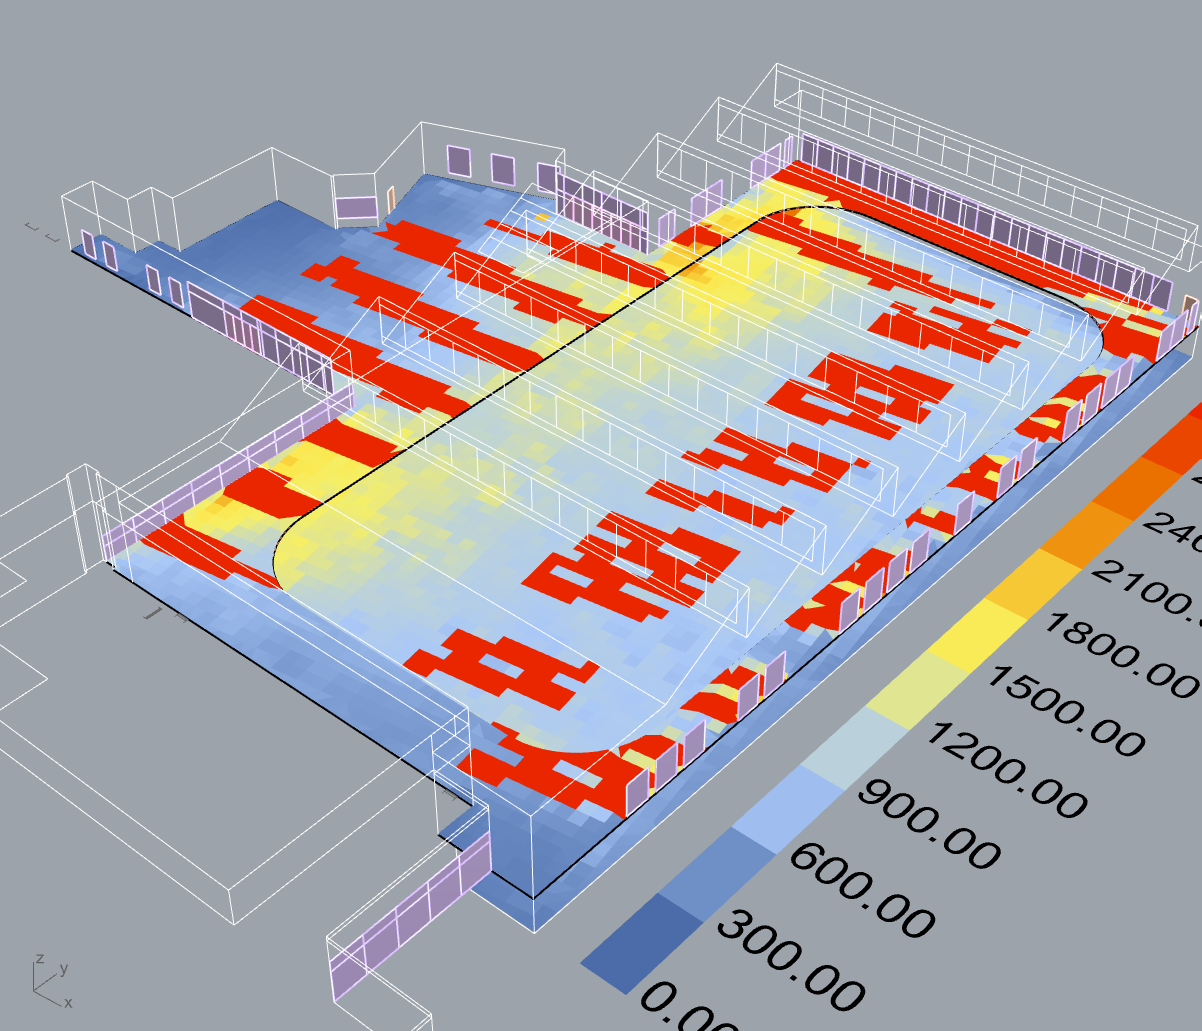
@charlie.brooker Hi Charlie, thank you for the tip with Dir in Rhino! That fixed the offset direction issue and the issue with daylight not coming through the east windows. I could try the grids, I’m not sure if Grid to Rooms would work with the walking track? It’s a floor with a cutout in the center and is set above the basement level.
If the way you’re building your grids is working for you (which it looks like it is) no need to try what I suggested - I expect you’re right that Grid from Rooms won’t work too well with the specific walking track geometry you’ve got in this model.
Would there be a way to have heatmaps on a multi-story levels? A component of sorts? The previous screenshot shows it merged together as each level as it’s own layer, but I imagine this would be more difficult on something like a multi-story apartment complex which our firm does pretty often.
The simplest approach for what you’ve got would be to input the meshes into a merge component, and then pass that to a list item.
Then you can use a tree branch component on the values (may need to right click simplify).
Attach a number slider that goes to both the branch input and the list item input, and the output of those to the spatial heatmap.
That should allow you to visualise one mesh at a time.
Another option would be to use Annual Daylight Metrics and the grid filter component, along with a similar filtering on mesh selection - but that would take some additional scripting.