Hey there!
Since I find Useful Daylight Illuminance (UDI) a much more accurate method to predict daylight performance than Daylight Autonomy (as UDI can possibly account for glare discomfort), I decided to look for an equivalent spatial metric of Spatial Daylight Autonomy (sDA) for UDI, i.e. Spatial Useful Daylight Illuminance (sUDI). As for the literature, I’ve only found Konis, Gamas and Kensek (2016) work, in which they used sUDI as an objective function for evolutionary optimization. So, if anyone has more research references on this subject please let me know!
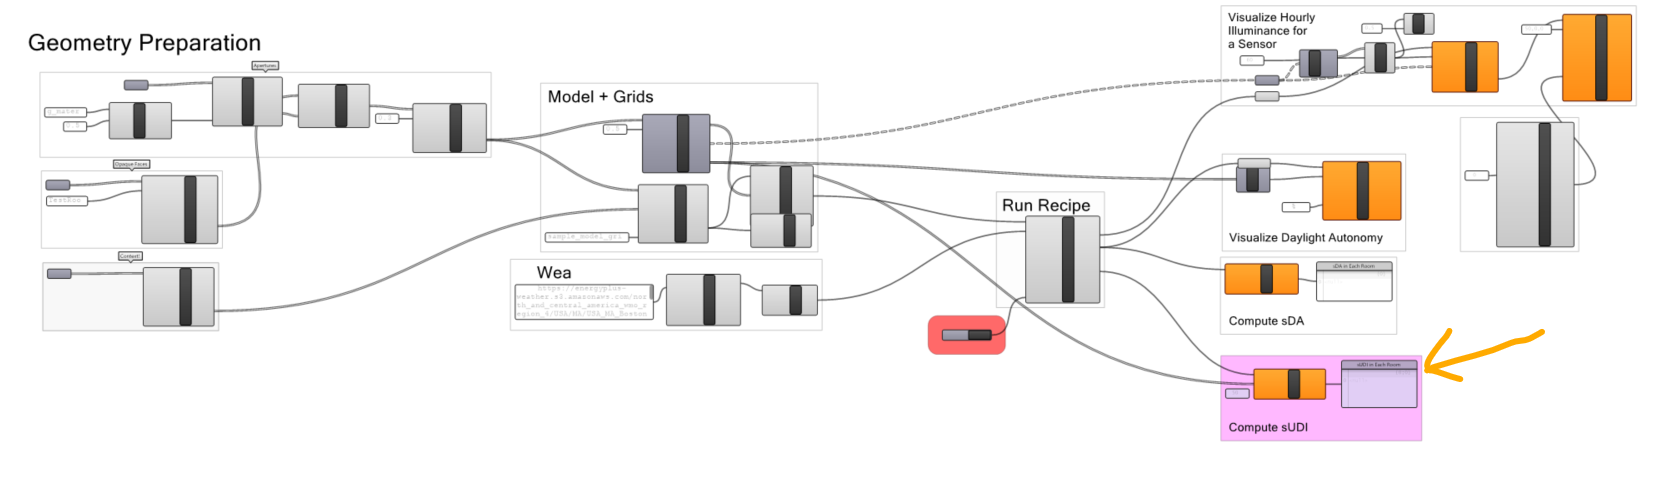
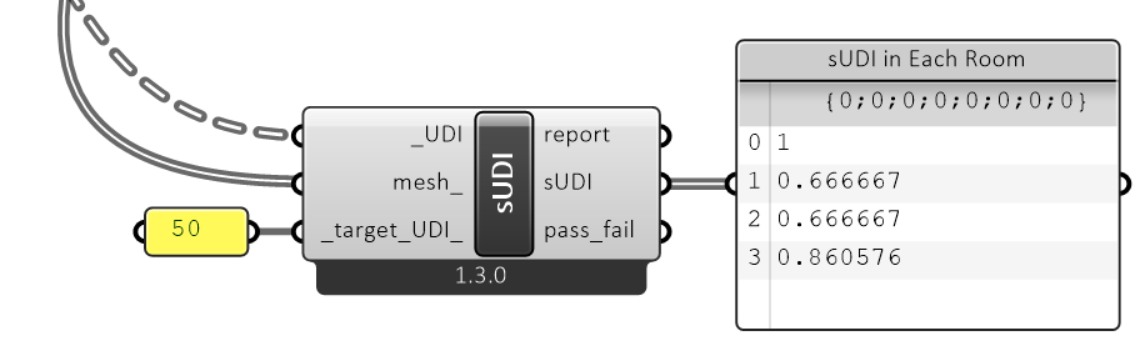
Now, for the LB part, I’ve made a custom sUDI component, which basically mimics the existing sDA component, though replacing all DA values for UDI ones. Here are the results:
"""
Calculate HB spatial Useful Daylight Illuminance (sUDI) from lists of useful daylight illuminance values.
-
    Args:
        _UDI: A data tree of Useful Daylight Illuminance values output from the "HB Annual Dalyight"
            recipe or the "HB Annual Daylight Metrics" component.
        mesh_: An optional list of Meshes that align with the _UDI data tree above, which
            will be used to assign an area to each sensor. If no mesh is connected
            here, it will be assumed that each sensor represents an equal area
            to all of the others.
        _target_UDI_: A number for the minimum target value for Useful Daylight Illuminance
            at wich a given sensor is considered well daylit. (default: 50).

    Returns:
        report: Reports, errors, warnings, etc.
        sUDI: Spatial Useful Daylight Illuminance as percentage of area for each analysis grid.
        pass_fail: A data tree of zeros and ones, which indicate whether a given sensor
            passes the criteria for being daylit (1) or fails the criteria (0).
            Each value is for a different sensor of the grid. These can be plugged
            into the "LB Spatial Heatmap" component along with meshes of the
            sensor grids to visualize results.
"""

__author__ = "gzbit"
__version__ = "2021.09.24"

import rhinoscriptsyntax as rs

ghenv.Component.Name = 'HB Spatial Useful Daylight Illuminance'
ghenv.Component.NickName = 'sUDI'
ghenv.Component.Message = '1.3.0'
ghenv.Component.Category = 'HB-Radiance'
ghenv.Component.SubCategory = '4 :: Results'
ghenv.Component.AdditionalHelpFromDocStrings = '1'

try:
    from ladybug_rhino.togeometry import to_mesh3d
except ImportError as e:
    raise ImportError('\nFailed to import ladybug_rhino:\n\t{}'.format(e))

try:
    from ladybug_rhino.grasshopper import all_required_inputs, list_to_data_tree, \
        data_tree_to_list
except ImportError as e:
    raise ImportError('\nFailed to import ladybug_rhino:\n\t{}'.format(e))


if all_required_inputs(ghenv.Component):
    # process the input values into a rokable format
    udi_mtx = [item[-1] for item in data_tree_to_list(_UDI)]
    _target_UDI_ = 50 if _target_UDI_ is None else _target_UDI_
    lb_meshes = [to_mesh3d(mesh) for mesh in mesh_]

    # determine whether each point passes or fails
    pass_fail = [[int(val > _target_UDI_) for val in grid] for grid in udi_mtx]

    # compute spatial Useful Daylight Illuminance from the pass/fail results
    if len(lb_meshes) == 0:  # all sensors represent the same area
        sUDI = [sum(pf_list) / len(pf_list) for pf_list in pass_fail]
    else:  # weight the sensors based on the area of mesh faces
        sUDI = []
        for i, mesh in enumerate(lb_meshes):
            m_area = mesh.area
            weights = [fa / m_area for fa in mesh.face_areas]
            sUDI.append(sum(v * w for v, w in zip(pass_fail[i], weights)))

    pass_fail = list_to_data_tree(pass_fail)  # convert matrix to data tree
Cheers, Gustavo