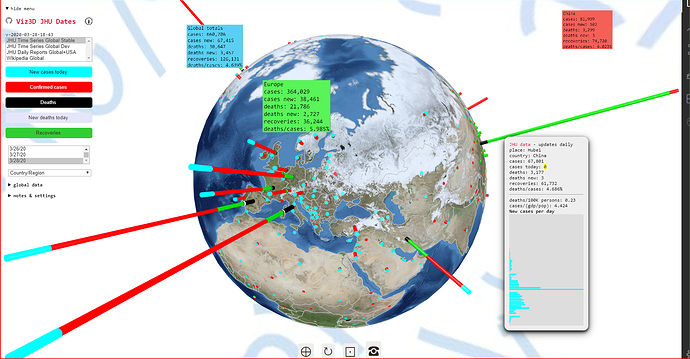
The Spider team is pleased to announce a new web page.
https://ladybug-tools.github.io/spider-covid-19-viz-3d/
https://ladybug-tools.github.io/spider-covid-19-viz-3d/dev
stable version for 2020-03-28 ~ 4 charts to choose from - shows number of new cases per day and many more statistics
The concept of the web page is to show you the current COVID19 situation around the entire world in 3 seconds or less.
- View the latest COVID-19 data from John Hopkins University GitHub repository with interactive 3D
- Provide entry-level programming code anybody can copy and make better
- Display all the data in seconds on any device then zoom and rotate and click to see the cases in 3D
Mentions with many comments
- https://twitter.com/electricdisk/status/1240735764071288837
- https://www.reddit.com/r/COVID19/comments/fkjby9/view_the_latest_covid19_numbers_from_around_the/
- https://discourse.threejs.org/t/covid-19-viz-3d-interactive-3d-globe/13613/8
Why are there messages in the background?
An early visitor to our tracker raised this issue “Expressions of Hope”
Oleg askeg “I wonder if we could show positive tweets and expressions of hope and gratitude for the courage of health workers around the world.”
What you see is our first attempt to give Oleg some delight.
- Zoom out then rotate. Trying to read the messages on a phone is a little guessing game.
- The text is huge and leaves much white space. This is so you are not totally distracted while looking at the data.
