Hello
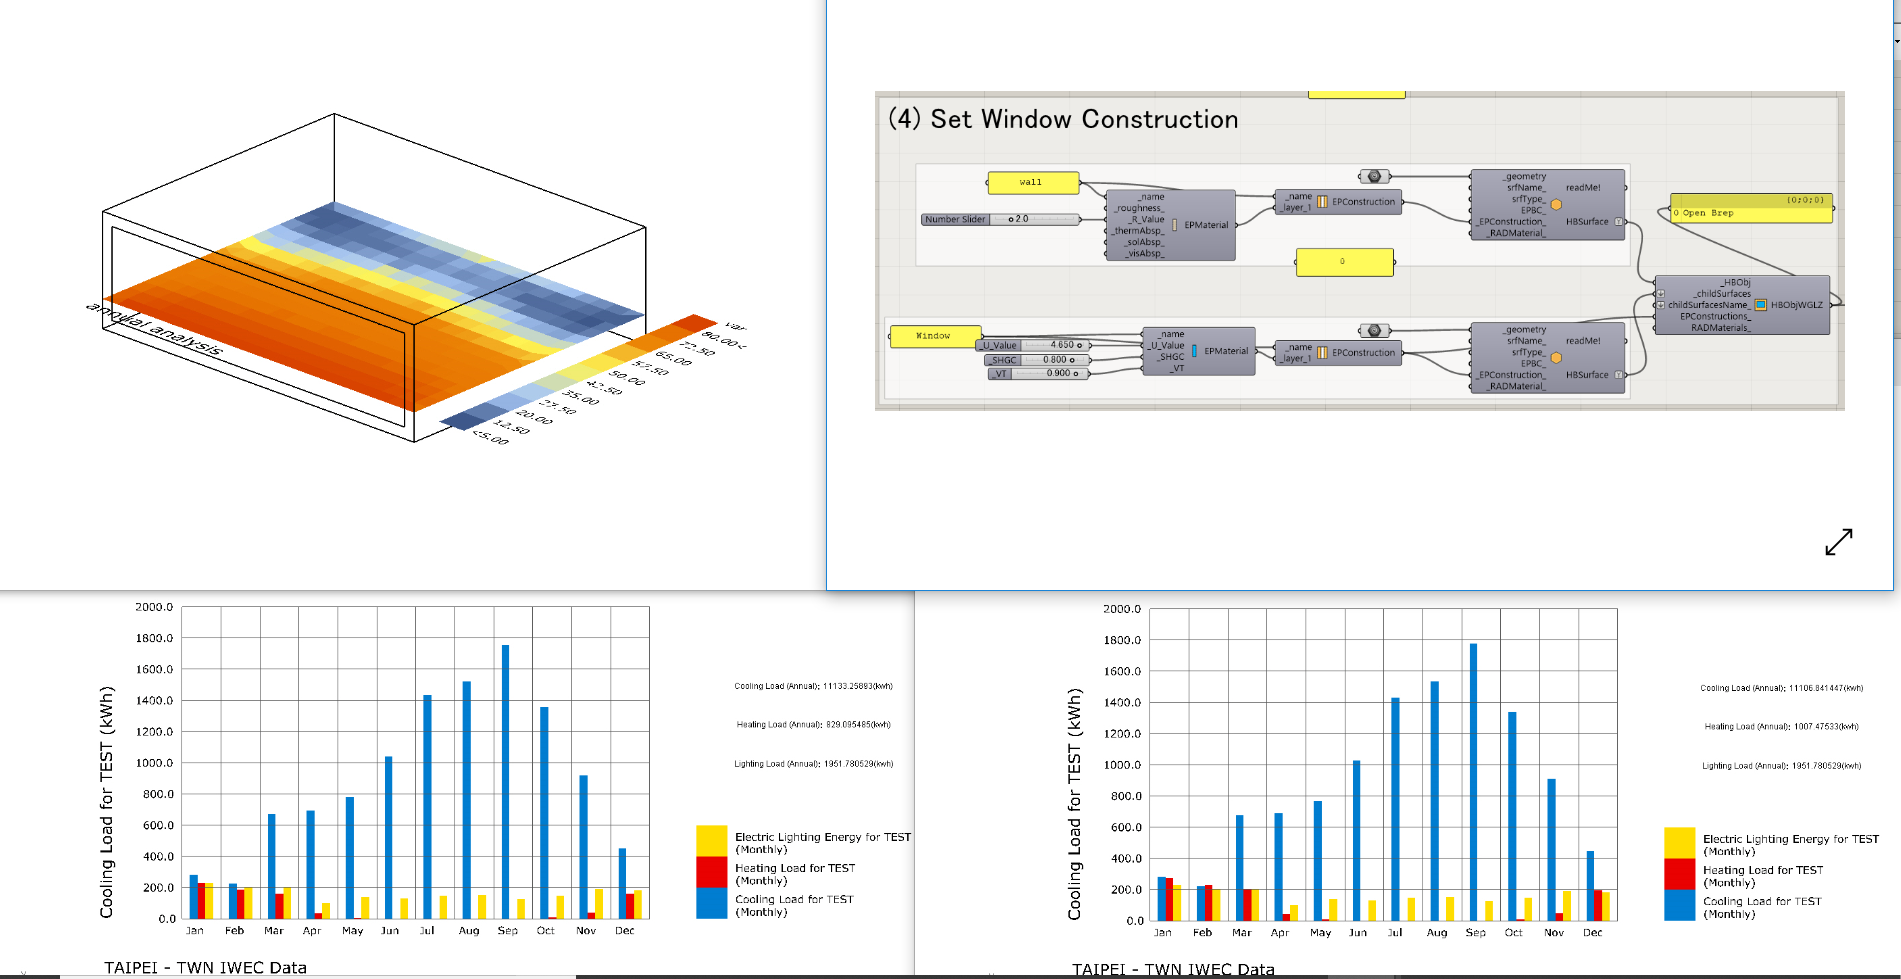
There are little difference in cooling loads(Annual) and heating loads(Annual) when I change U-value (Left graph : 2.65 or Right graph : 4.65).
Annual cooling, heating, lighting loads is on left side of graph.
Is the simulation result collect or not?