I’m trying to generate a heatmap of SET in a semi-outdoor space for a given timestep. I’ve used the HB UTCI Comfort Map to generate environment matrices, which I’m deconstructing and inserting into the LB PMV Comfort component, then looking at the set output and plotting with a mesh on LB Spatial Heatmap.
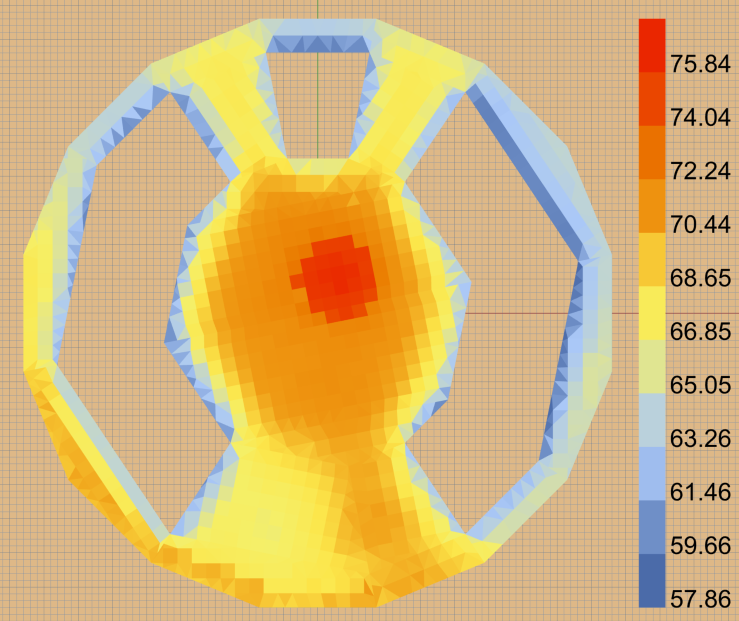
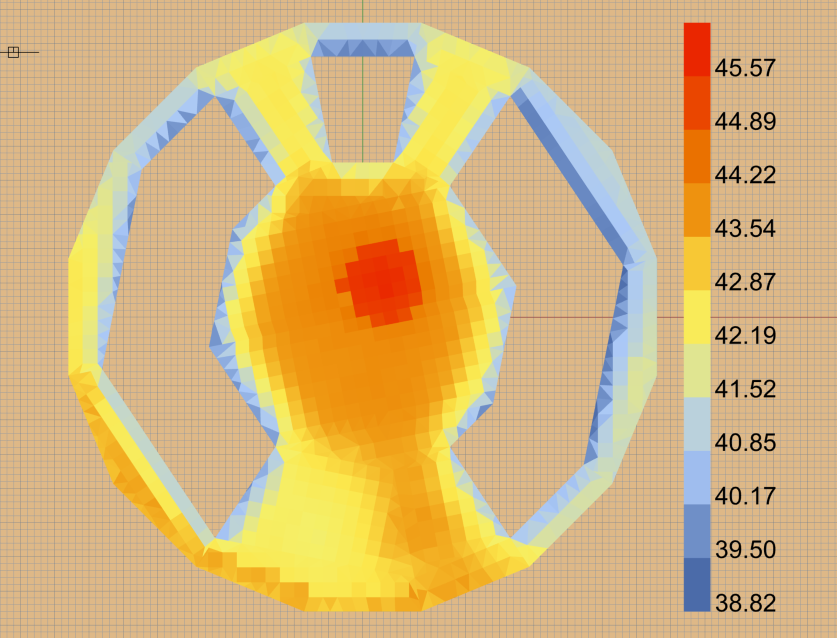
All the other inputs (air temp, RH, air speed, metabolic rate, clothing level) are single values. Yet, when I combine these inputs to get a spatial distribution of set, I get a funny looking map when I increase the air speed to 0.7 m/s:
I realise this component was designed for generating a time series of set values, rather than a spatial distribution, but I’m nonetheless confused why this is happening.
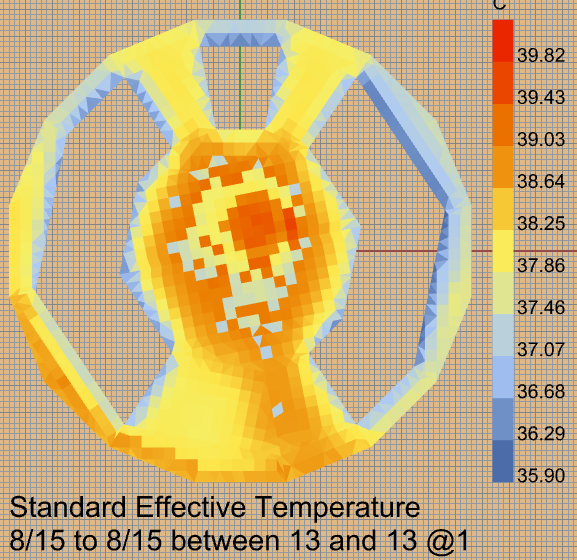
Do you get the same results if you run the HB PMV Comfort Map with the write_set_map_ option set to True?
The PMV recipe is designed to calculate SET, though it does not always do this by default because it can add a lot to the run time.
That will help make it clear whether you are seeing a real effect here of the model’s thresholds vs. maybe something happening with your data trees being mis-aligned.
Hi @chris,
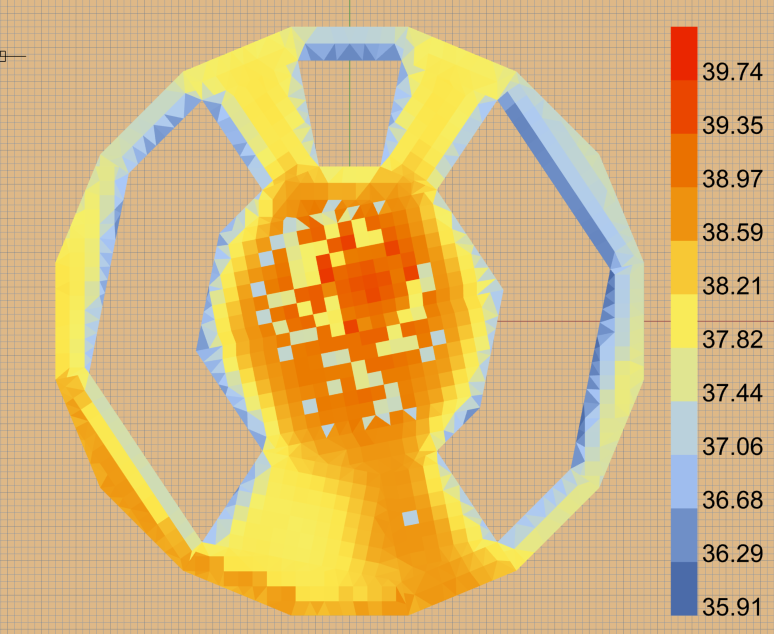
Thanks for the idea (I guess that was what I should have done in the first place), but I still get this strange pattern at higher air speeds
Good to know. In that case, you are probably experiencing the effect of some threshold within the SET model. You can check the source code here:
Maybe it’s the result of this wcrit variable here, which is definied in terms of air speed:
SET is far from a perfect model. If you are trying to understand the thermal experience of the outdoors in a manner that accounts for the subject’s metabolic rate and clothing level, I would usually recommend the PET model over SET.