I was just wondering the same - if not - could I plot temporally the number of cloudy days and simply overlay that over glare potential chart (I believe this is the video you mentioned)
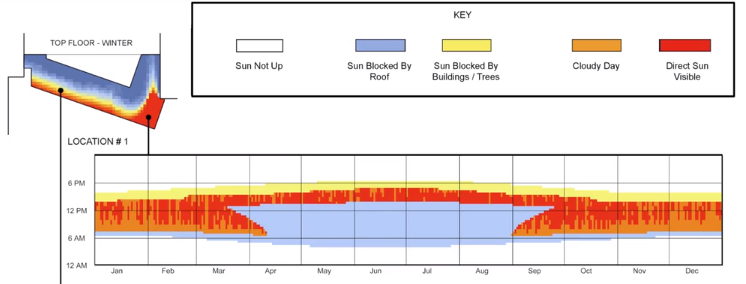
But, instead of computing the % floor area in sun, I ran a sunlight hours study for a single point in space. Then, I ran separate sunlight hours studies for the different pieces of context I wanted to represent differently (eg. buildings/trees vs. roof). Instead of a simple 0 or 1 for “sees the sun” or “doesn’t see the sun”, I converted the result to be either 0 or a unique integer. Then I summed those integers together to get a single list of 8760 integers, plugged the list into the Hourly Chart component, applied some custom colors to the plot, and there you have it.
So there’s no special component for this type of analysis beyond the sunlight hours component. It just involved some post-processing with the native Grasshopper components to categorize the different things blocking the sun at each hour with a different integer.