Hello,
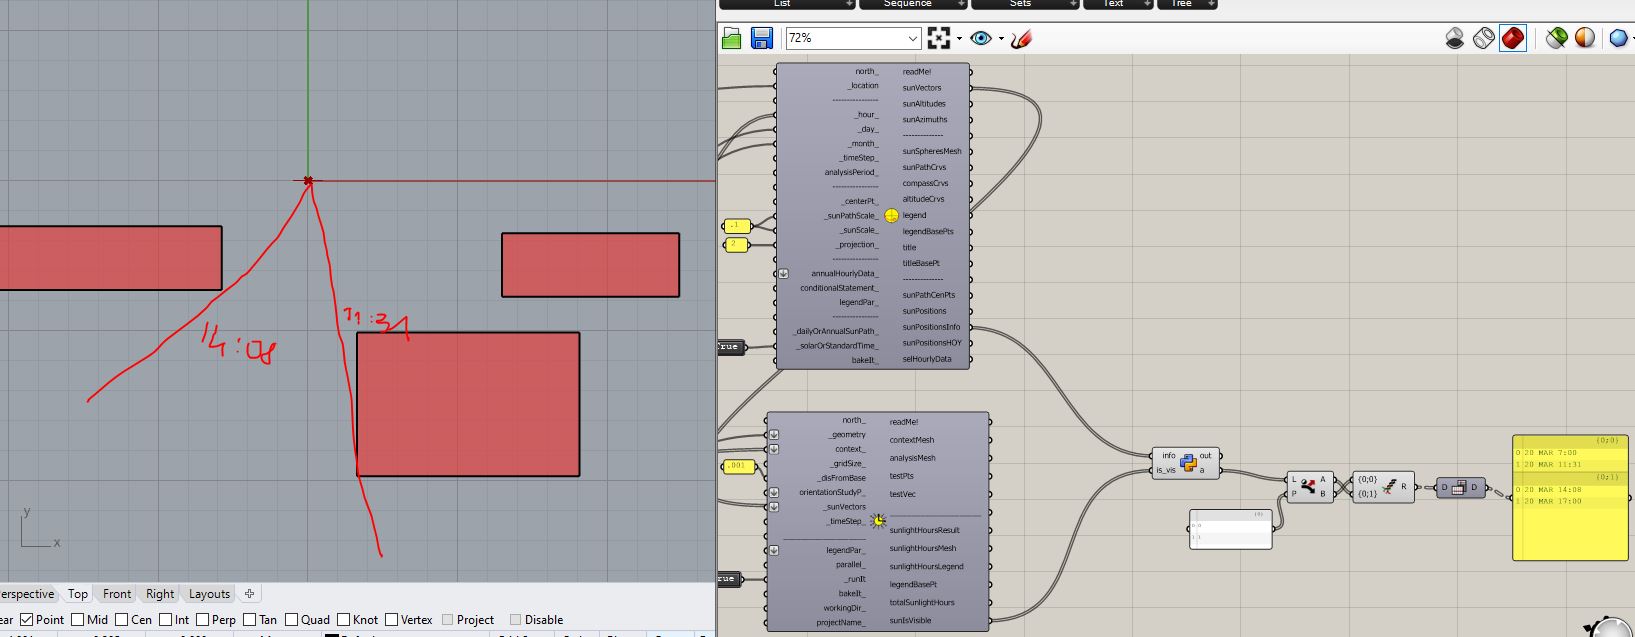
is it possible to get the begining and end hour for many periods of time when the sun is visible? (fx. sun it visible between 9-10 and 13-17 etc.) I created a sample file where sun is visible twice during the day, and would like to generate simple list with time periods of sun visibility.
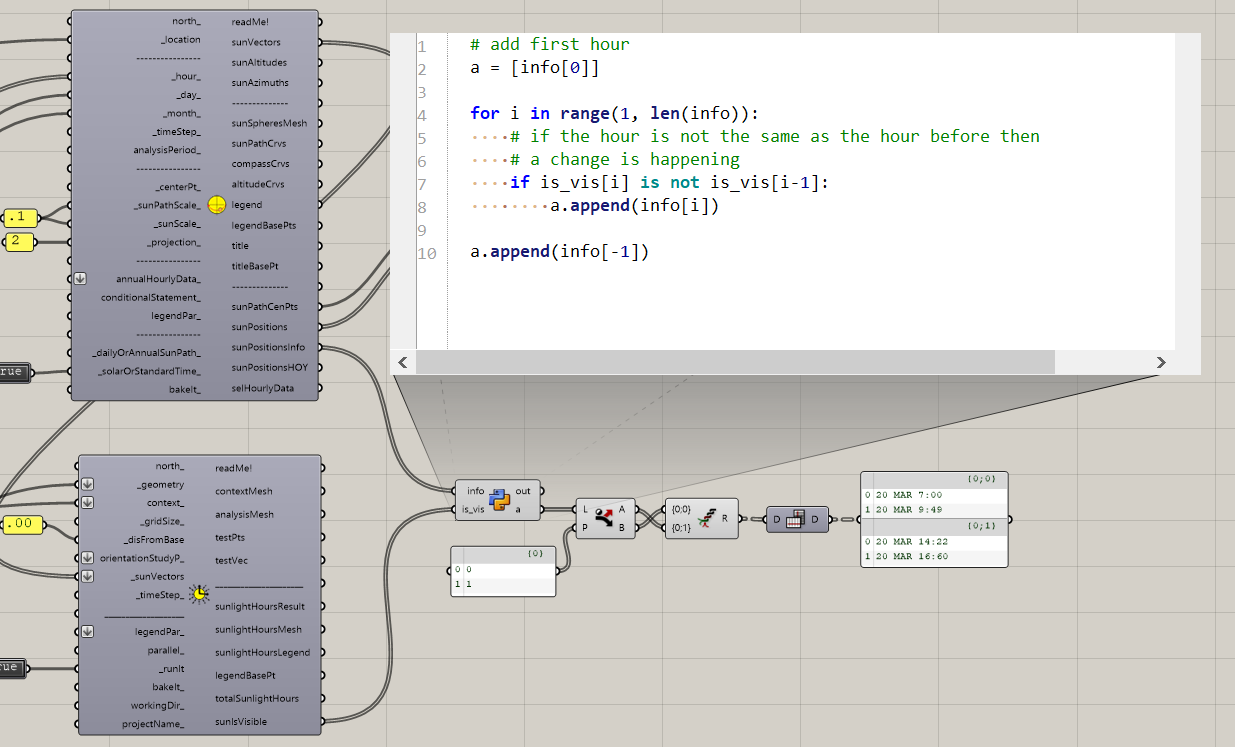
For a single day it is straight forward. For several days you need to group the data for each day. There is a component in Ladybug that does that for you.
Grasshopper’s index component didn’t work as expected so I wrote the first part in Python. You should be able to create the same logic in Grasshopper.
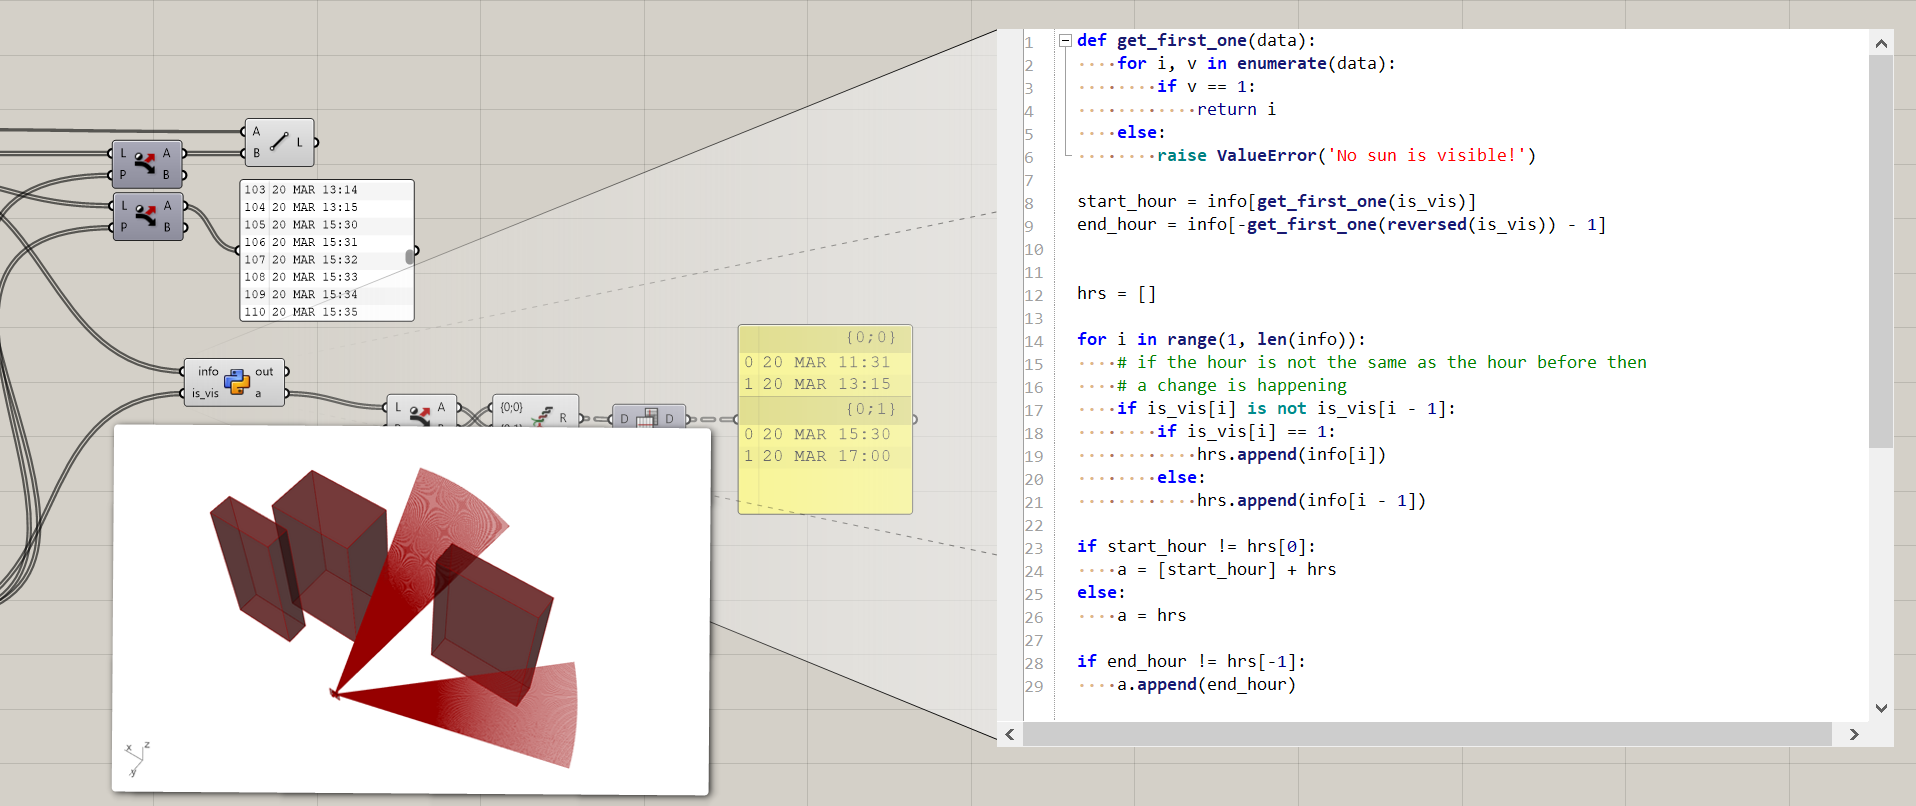
thank You for posting the script - it works brilliant. The only problem appears when the context geometry clashes with the sunlight vector at the begining and at the end of the time priods. So if the first sun vector is “0” then the script will give wrong answers. Can You point out how can I solve that problem? Thank You for answer.
yes, that script works perfect. How to deal with grafted data as an input? If there are more points, I need to flatten the input. By doing so, I will loose the track of each point. Is there a way to have grafted data as an input inside Python script or it should be done outside Python? I appreciate your taking the time to answer my question. It has really helped me understand the Ladybug.
Dear @mostapha,
unfortunately, according to the norm that I have to follow, I have to analyze only one point on the window.
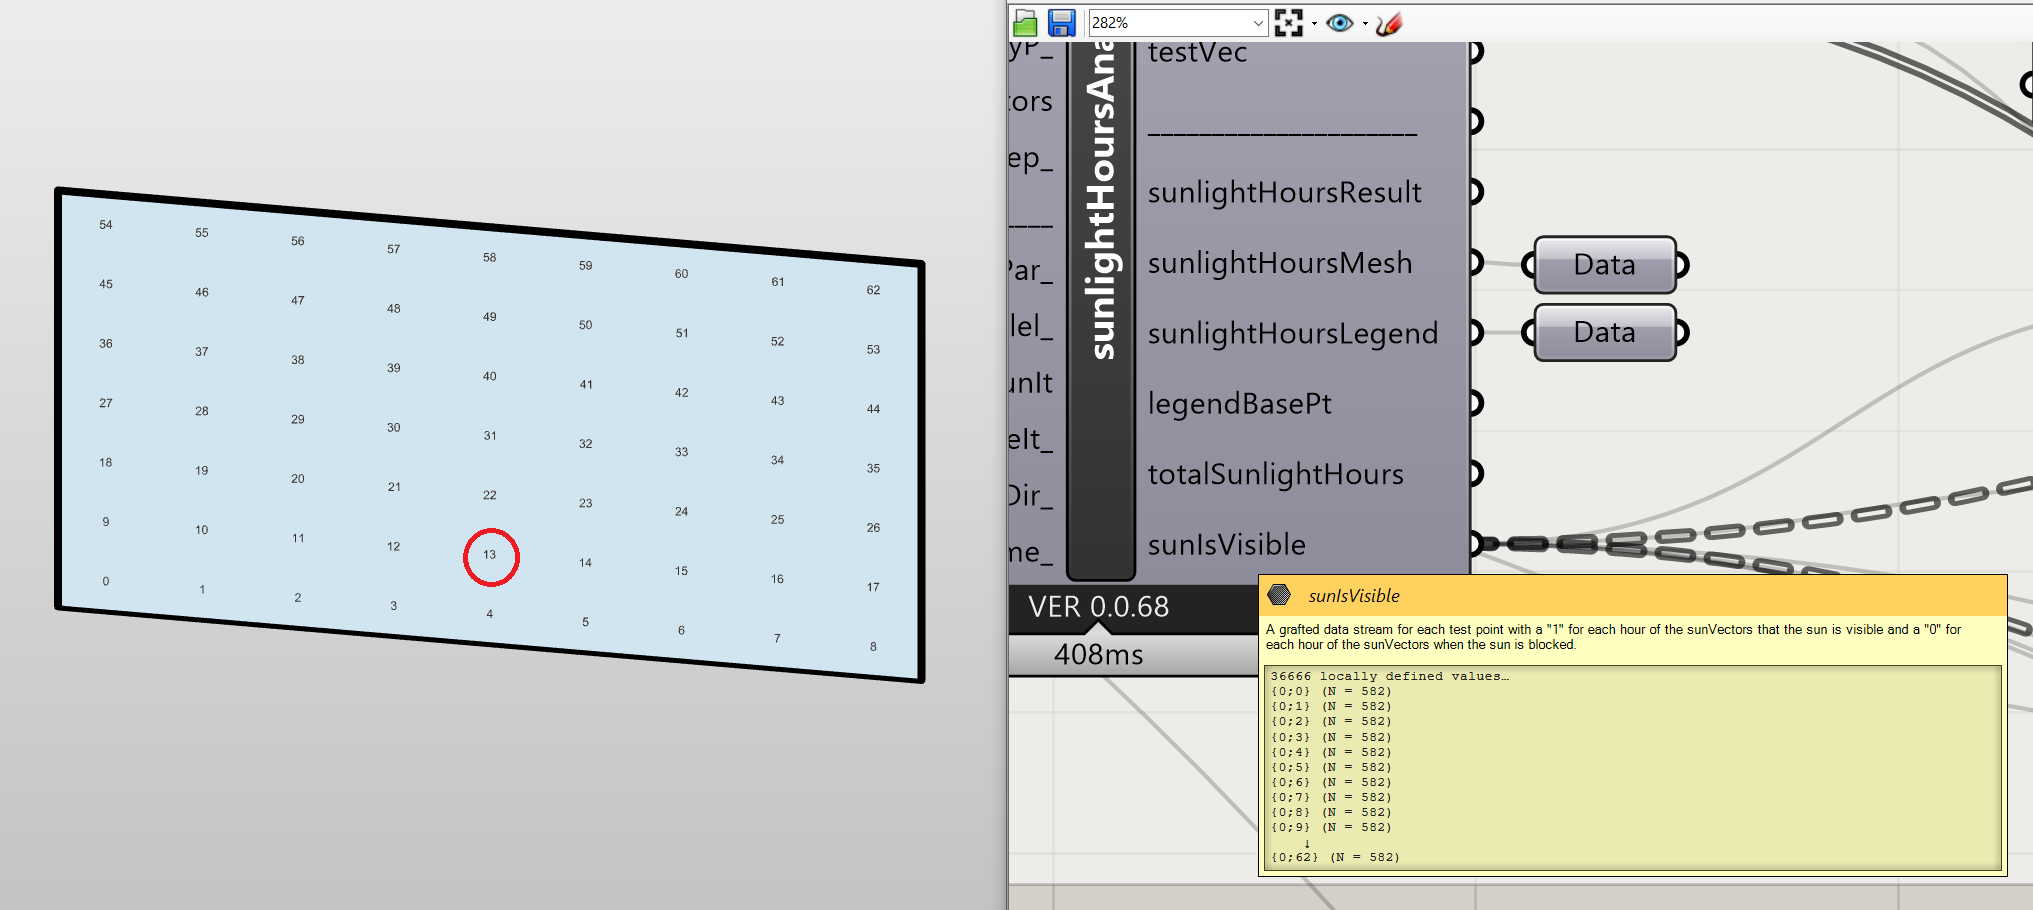
Remaining on this topic, not being able to analyze a single point, unless it is in the center of the surface, is possible to filter the data out from sunIsVisible, only for a specific analyzed point (see the image), in order to extrapolate the minutes/hours in which the sun is visible and the period of time?
I tried through the Dispatch Indices, but I haven’t come to the solution. Some advice?
No. The other way around. The sunIsVisible output grafts the data for each sensor. You should add a slider and pick the correct branch for each point.
See the answer above. The results for each sensor is in a separate branch so you can walk through the results one by one.
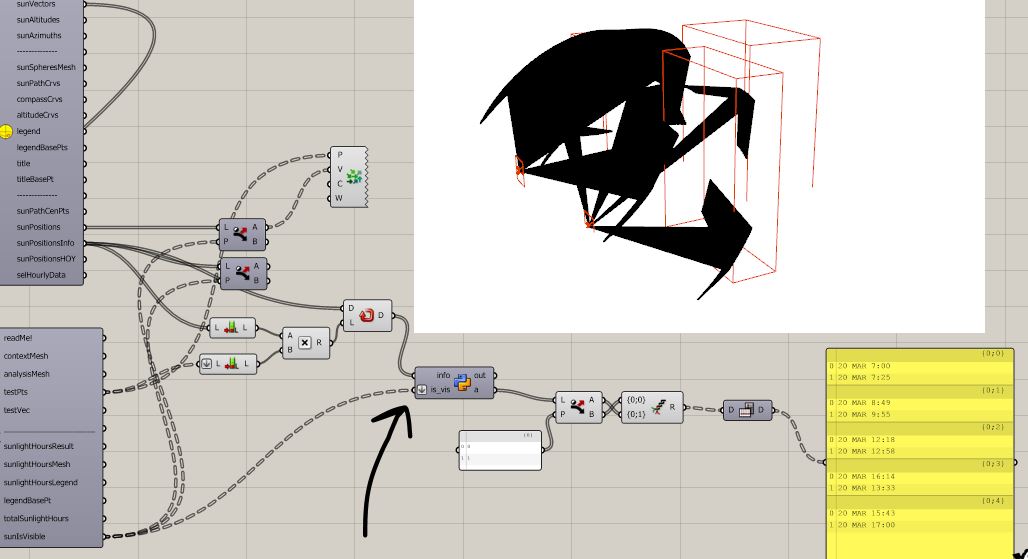
If you want to run the study for several days then you need to do another filtering for that. Here is an example with multiple points and multiple hours. Note the 3 sliders in the bottom of the script.
PS: NEVER use the sun position for the visualization of rays unless your test points and the center of the sunpath are the same. You must always use the vectors and recreate the rays. See the top part of the sample file.