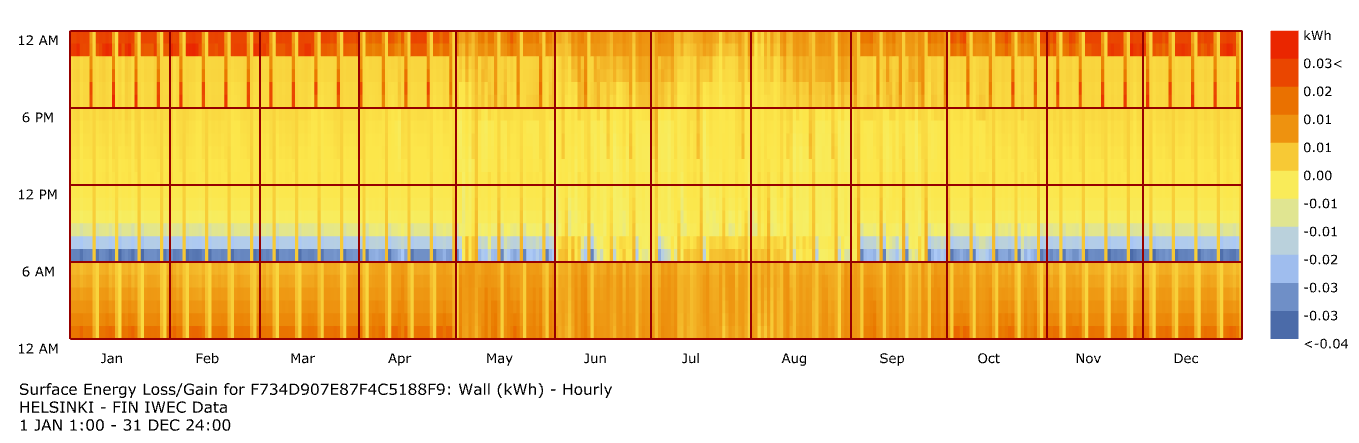
Is there something wrong with Opaque Surface Energy Loss/Gain results? Attached are the results for a back wall of a shoe box model, with EPW for Helsinki. There are two things I do not understand:
Chart shows gains in the middle of the winter and Llosses (negative values) sometimes in the morning. (Glazing surfaces show expected results: gains in the summer time and losses in the winter time)
This surface is adiabatic. Shouldn´t the energy flow be zero at all times?
@Eero, I think this might be showing the thermal storage of the wall. That would explain the ‘reversed’ thermal profile. Adiabatic walls aren’t actually zero-flux barriers. In the EP engine the outside surface of the adiabatic surface is defined by the same surface, but mirrored. The mirroring is what creates, in net, zero heat transmission (as there is no temperature difference at the line of symmetry to result in heat transfer). This allows the adiabatic surface to model the thermal mass effects of the construction.
That being said, I’m not sure if the Surface Energy Gain/Loss result metric tracks this phenomena.
A couple of things to check to verify this:
The cumulative sum of the heat gain/loss for that surface should be approximately zero after a yearly simulation (gain/loss should cancel out).
Changing the specific heat capacity of the adiabatic surface should result in higher absorption/release.
Maybe try that?
Also what’s the (normalized) magnitude of the energy gains/losses for one of your non-adiabatic surface, with this one?
It’s possible the change in specific heat capacity has such a marginal effect it doesn’t show up on the heat map.
Can you try the other two suggestions I made:
Show a heat map of a similar surface that is not adiabatic, I would assume the adiabatic one should show several orders of magnitude less heat gain/loss, reflecting just the thermal mass impact.
Secondly, can you add your hourly values together for the adiabatic surface? You can use the mass addition component. This should be close to zero.
I just wanted to confirm that you explanation is correct @SaeranVasanthakumar and confirm that the surface energy flow output that is requested from EnergyPlus is the net flow across the construction. This means it accounts for both the +/- heat flow on the inside boundary of the surface as well as the +/- heat flow on the outside boundary of the surface, which @SaeranVasanthakumar explained is 0 for an adiabatic surface. So what you are seeing there is just the heat flux across the interior boundary.
I wouldn’t really expect changing the overall thermal capacity of the construction to affect your results much since most of the heat exchange is happening in the first couple of cm of the construction and not in the deeper layers. What you said about the sum of all heat exchange being close to 0 is true, though, @SaeranVasanthakumar. At the least, the sum should be pretty comparable to the hourly heat flux values you are seeing there in the chart.