I need to analyze the indoor temperature of my zone in comparison to my outdoor temperature because in Brazil we need to verify the compliance with the design requirements of NBR 15.575 standard performance.
I need to get a graph that shows during all the day how my indoor temperature behaves in relation to the outdoor temperature.
Hi @libner.melo,
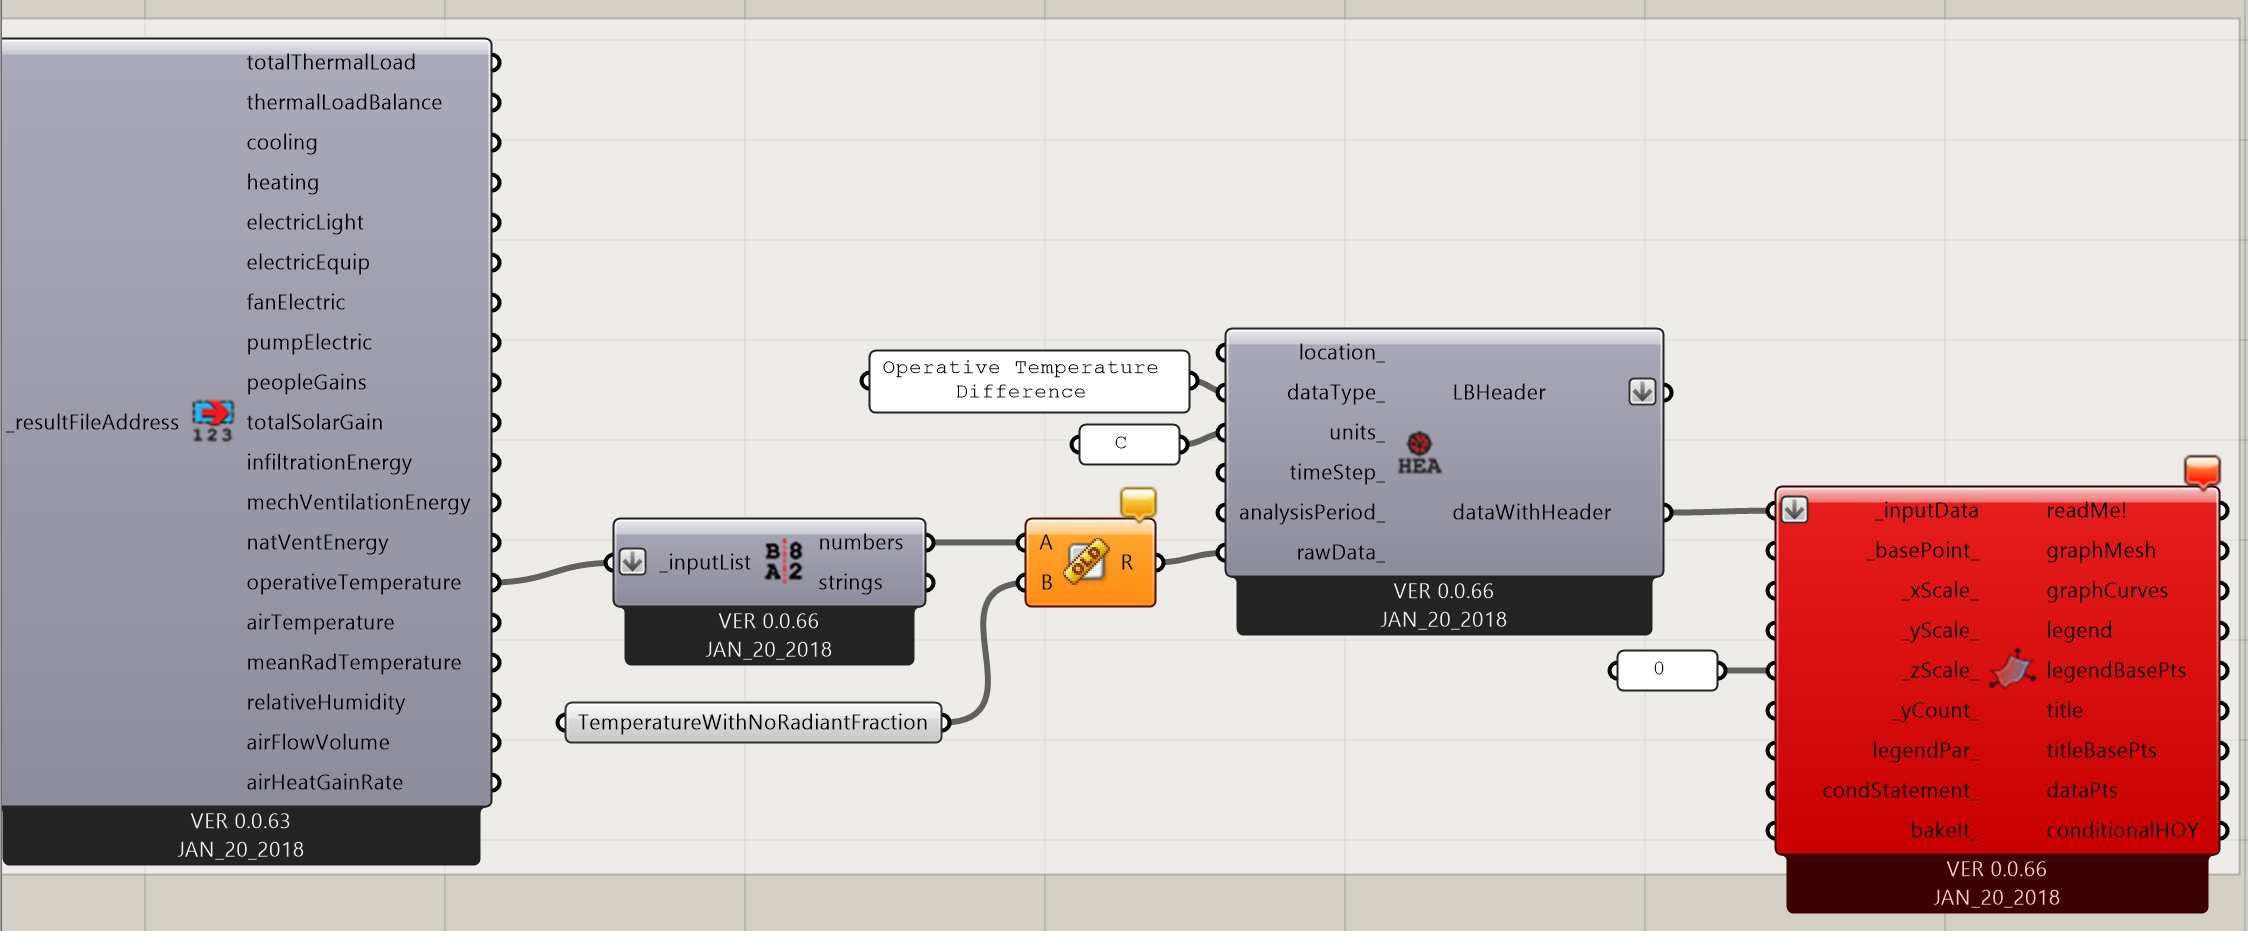
You can use this workflow. May be you don’t want to follow the last steps to plot PMV. It shows how to get the zone temperatures. Once you get those temperatures comparing with outside drybulb temperatures will be a matter of using 3D Chart I believe.