I will soon introduce Fairyfly to the users of my channel for the purpose of conducting two-dimensional heat transfer and thermal bridge analysis.Currently, when I use Fairyfly, everything is working extremely well.
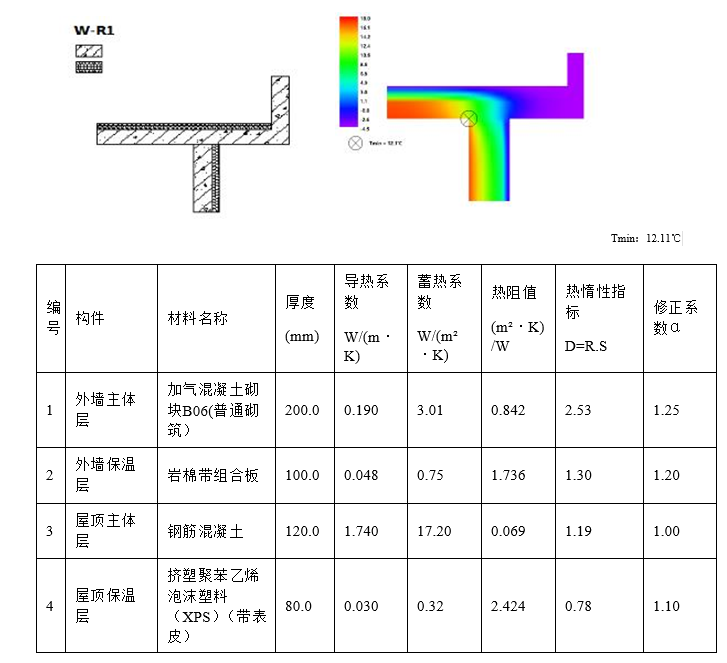
In my practical application, I often use THERM like program for condensation analysis. This is an essential step for us to obtain the green building certification in this region.In this stage, we need to disclose the heat transfer situation of a certain component’s two-dimensional plane and inform about the thermal properties of the related materials. Therefore, there is usually a comparison diagram which is used to distinguish between the simulated results and the actual floor plan of the construction model.
This is an example diagram. Although most of it is in Chinese, it is almost identical to my description. However, as you can see, the image resolutions provided by many programs are not very high, even when electronic originals are offered. In such situations, having some high-resolution images available in electronic format might be a relatively good option. In my experience, embedding SVGs into PDFs doesn’t cause any loss even when they are enlarged many times. Thanks to Typst.
I can see that the result of THERM is in favor of vis_set. This can be easily integrated into my electronic report through SVG. However, I found that the FF Model with material labels does not support direct export as Vis_Set. Although I can create a custom Visualization Set through the SDK, I believe this option could potentially benefit a larger number of people.
I knew this question about a vis_set output to “FF Color Shape Attribute” would come up at some point but this is a little sooner than I was expecting and you are ahead of the curve as usual. The short answer is that the vis_set output can definitely be added but it requires a little bit of work from me. I basically need to add a fairyfly_display python package that works similar to the honeybee-display one. Then, you’ll be able to get visualization sets and SVGs of the Fairyfly model. If you give me a little time, I will get to it eventually.
As for the SVG of the THERM result mesh, the issue is not that meshes cannot be rendered to SVG but that SVG doesn’t have an easy way for me translate meshes that are colored vertex-by-vertex as opposed to face-by-face. Most meshes that we create in Ladybug Tools are colored face-by-face and, in this case we can translate each colored mesh face to a separate SVG polygon. However, when meshes are colored-vertex-by-vertex you ideally need to interpolate the colors from one mesh vertex to another the way that Rhino does. And I could not figure out a way to specify this within the SVG schema.
If I can make a recommendation of how you can display the THERM results in an SVG format, the LB Contour Mesh component has a vist_set output that should make the THERM results look good in SVG.
Thank you for your clarification. Now I’m already looking forward to using fairyfly-display.
I know that the polygon fill feature in SVG can only achieve some linear gradients or radial gradients. Apart from increasing the file size by adding more triangles to the grid for a more detailed subdivision and approximating it, there doesn’t seem to be any better way to output it as an SVG image.
Although in many cases this may result in less smooth outcomes, the current Visualization Set has already added polygons with gray fill, adding colors might be better. I suggest trying this temporary solution first until the best solution emerges.
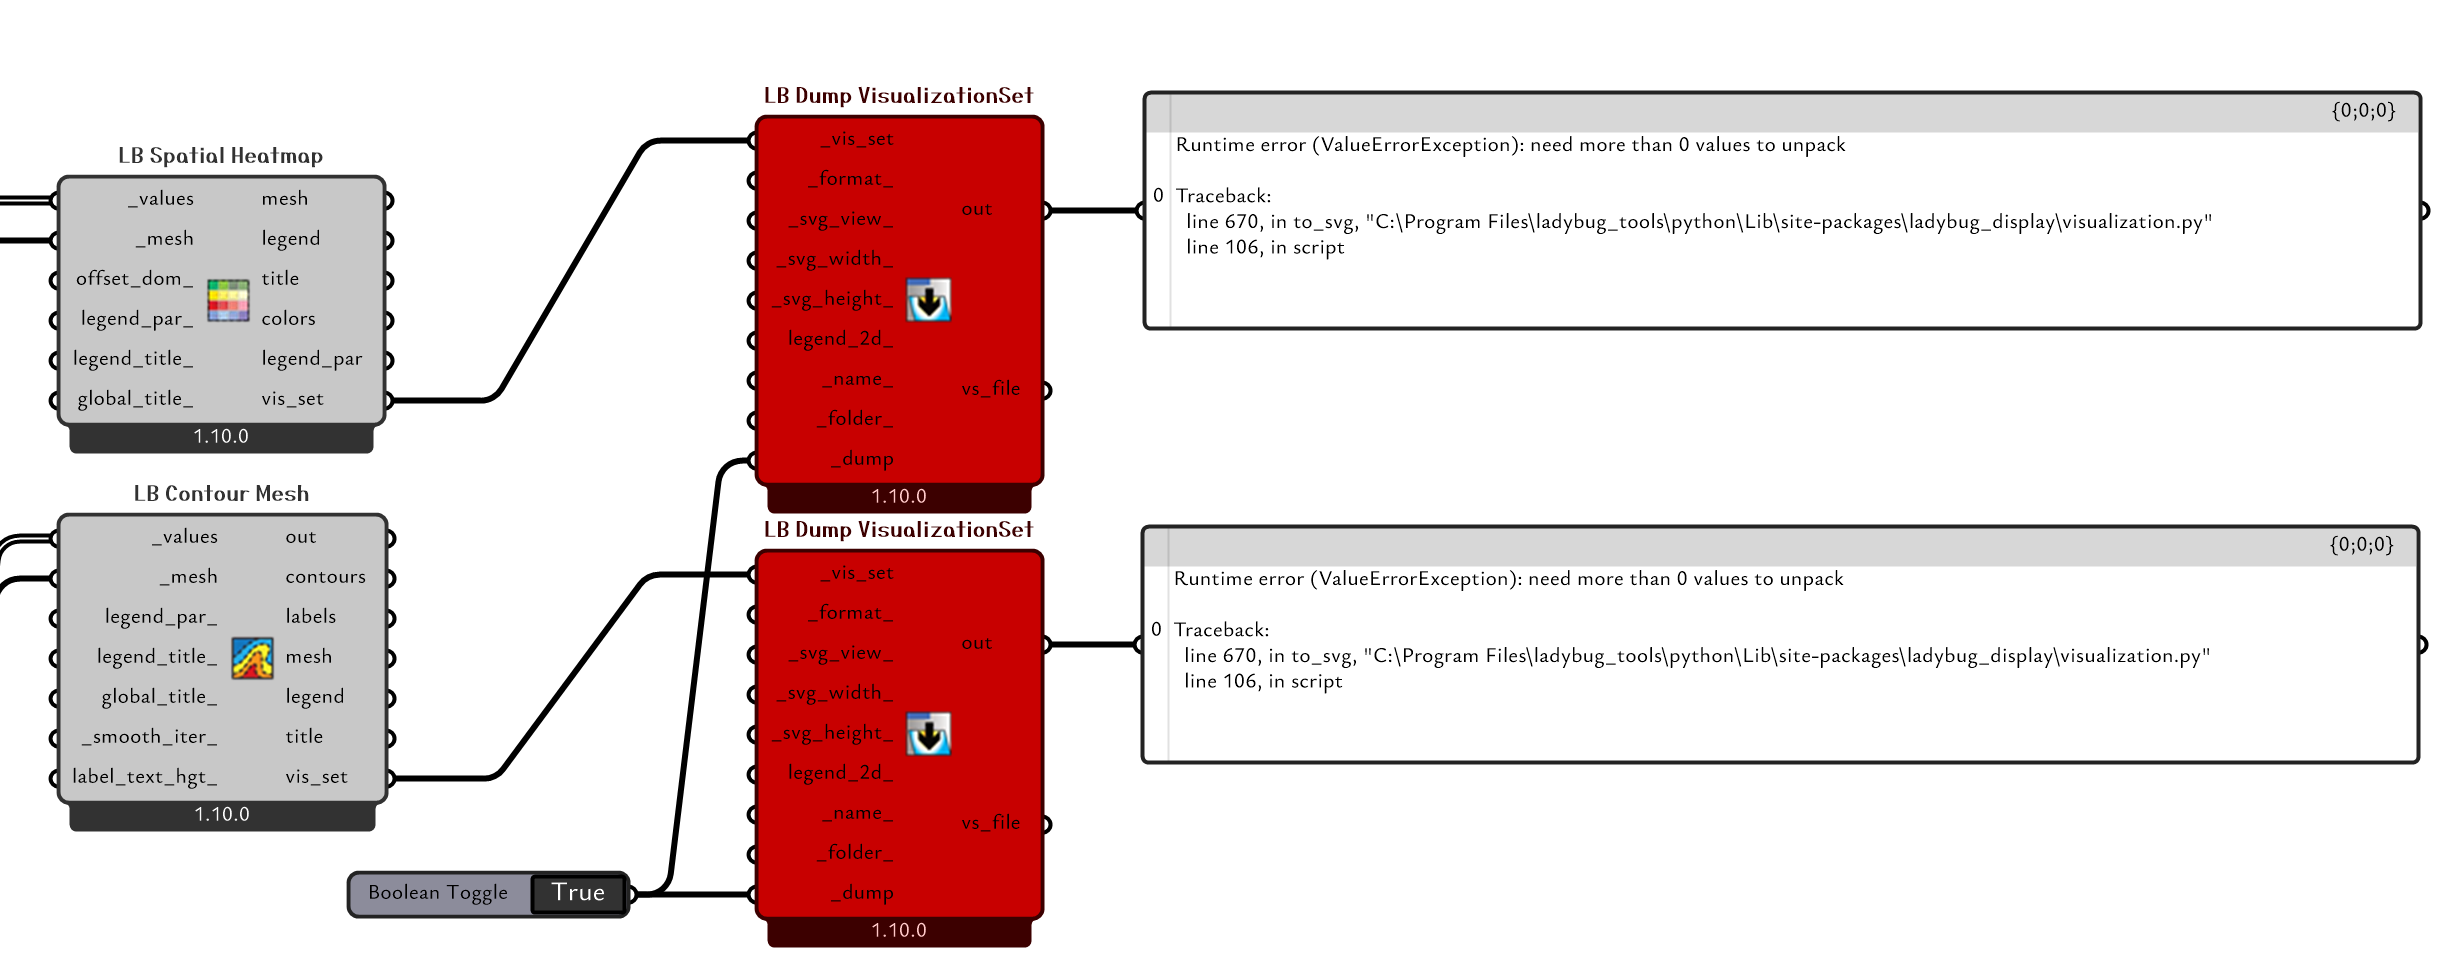
I tried implementing the solution you provided, and perhaps I have discovered a bug.
… and it should be available via the LB Versioner in ~20 minutes or so. It only affects the translation of VisualizationSets to SVG when there is only a colored mesh in the visualization set without any other line geometry (so the visualization sets of most of the ladybug graphics are unaffected).
I also made some changes so that, instead of getting a grey-scale mesh when it has values vertex-by-vertex, it will just convert the mesh values to be face-by-face as it translates it so SVG. So this is the result that you will new get: