Hello all,
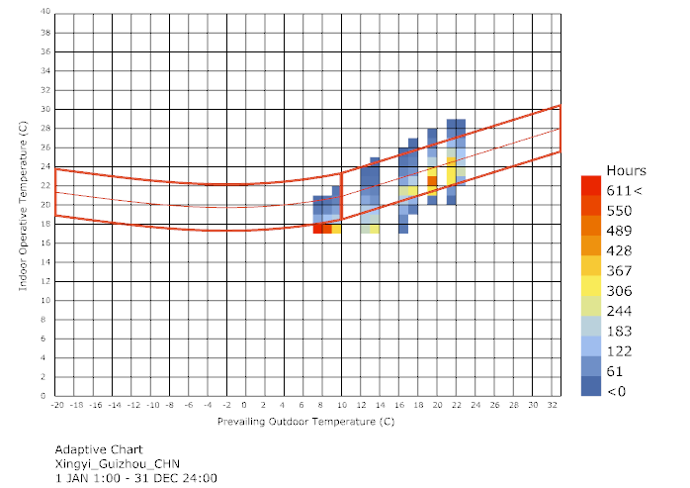
I have one simple but imortant issue about how to read the legend of adaptive comfort chart. I got the legend which show the different percent of comfort hours, I input whole year data and the total hours are not equal to 8760 hours, I did not chage the boundary conditions of the legend. I thought the component would calculate the whole year data and the coloured meshes that lie in comfortbale polygon are comfort hours and the rest ones outside the polygon are the percent of discomfort hours.
Am I right on this? Or could you all to help me to solve this comfused question to me?
Regards,