Hi all,
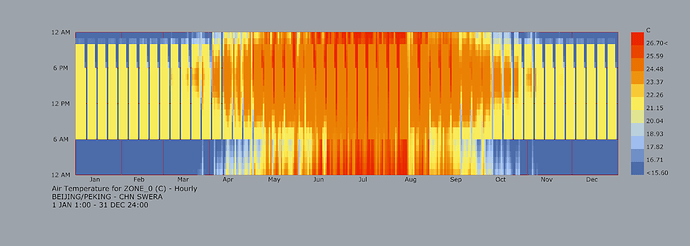
I want to use honeybee to simulate the annual air temperature of a simple box zone ,but the result seems strange.As is showed in the graph,in some days ,before 6am it’s stably blue,but after 6am,it suddenly becomes yellow.Is it normal and why is it that ? How can I correctly simulate indoor temperature of a simple box?
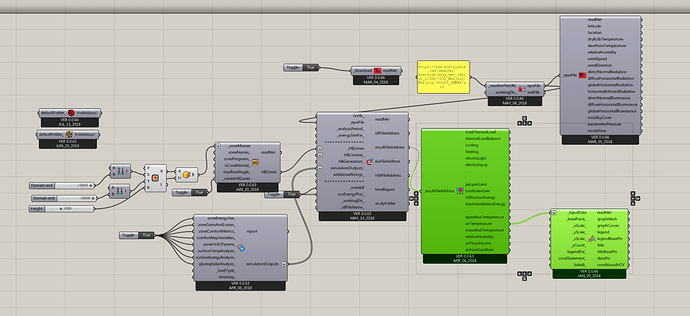
I’ve attached some screenshots and gh file below.
This is one of those cases where you can say: “Garbage in, Garbage out”.
You just get a working file, where the simulation is done and you get and show some results.
But … the question now is “Do the settings make sense?”, “Are my simulation assumptions right?”
For this case you are taking all the default values HB is giving, since you didn’t define any of these: Materials, schedules, HVAC, and more, and more.
It is good that you are suspecting of these results. Now you need to dig in and define your stuff. There are some examples in hydra and also a series of videos @chris prepared a while ago for that purpose. Easy to find.
Good luck!
-A.
2 Likes
Maybe I need to learn more about it .Thanks for your reply.

