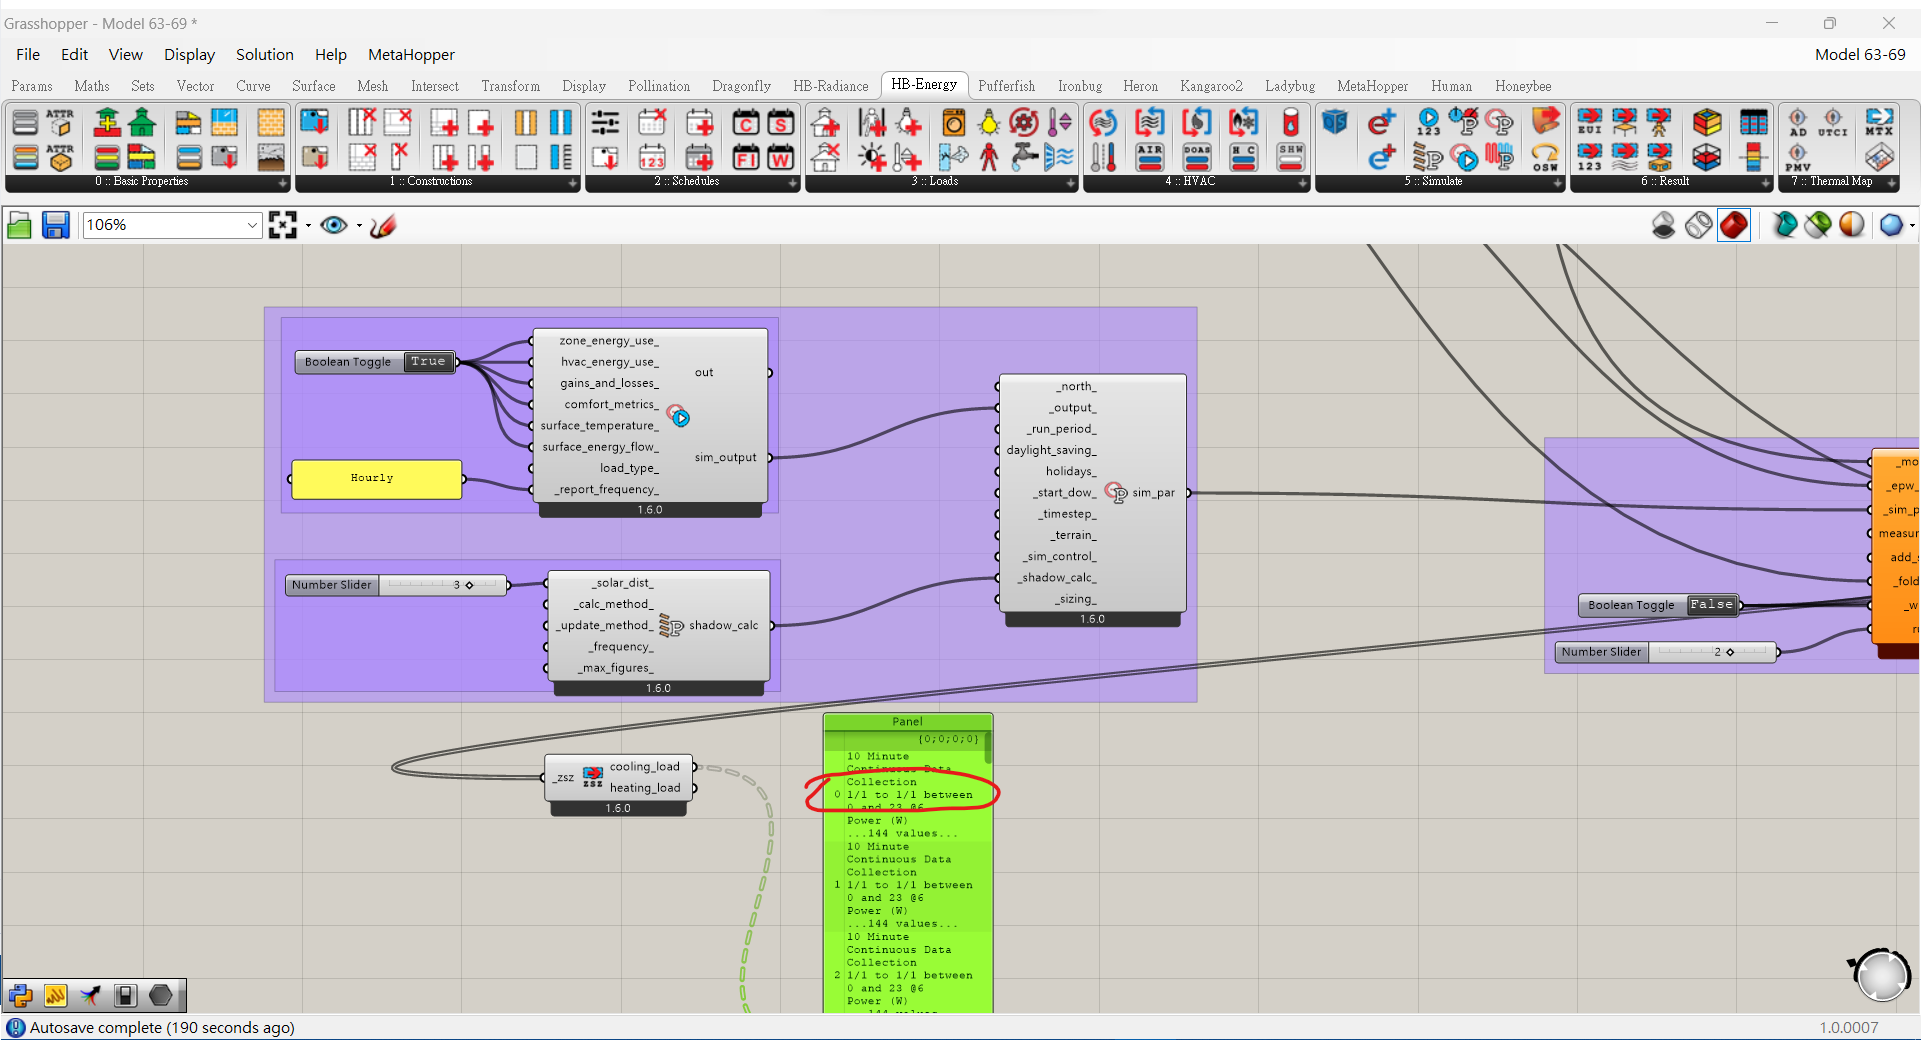
i have set “hourly” in the simulation output. However, when I tried to plot the graph about cooling load in W, i discovered that the time range is in 1day, which is circled in red. Is there anyone explain to me? If there are solutions, how can i solve it, thanks