Hi everyone,
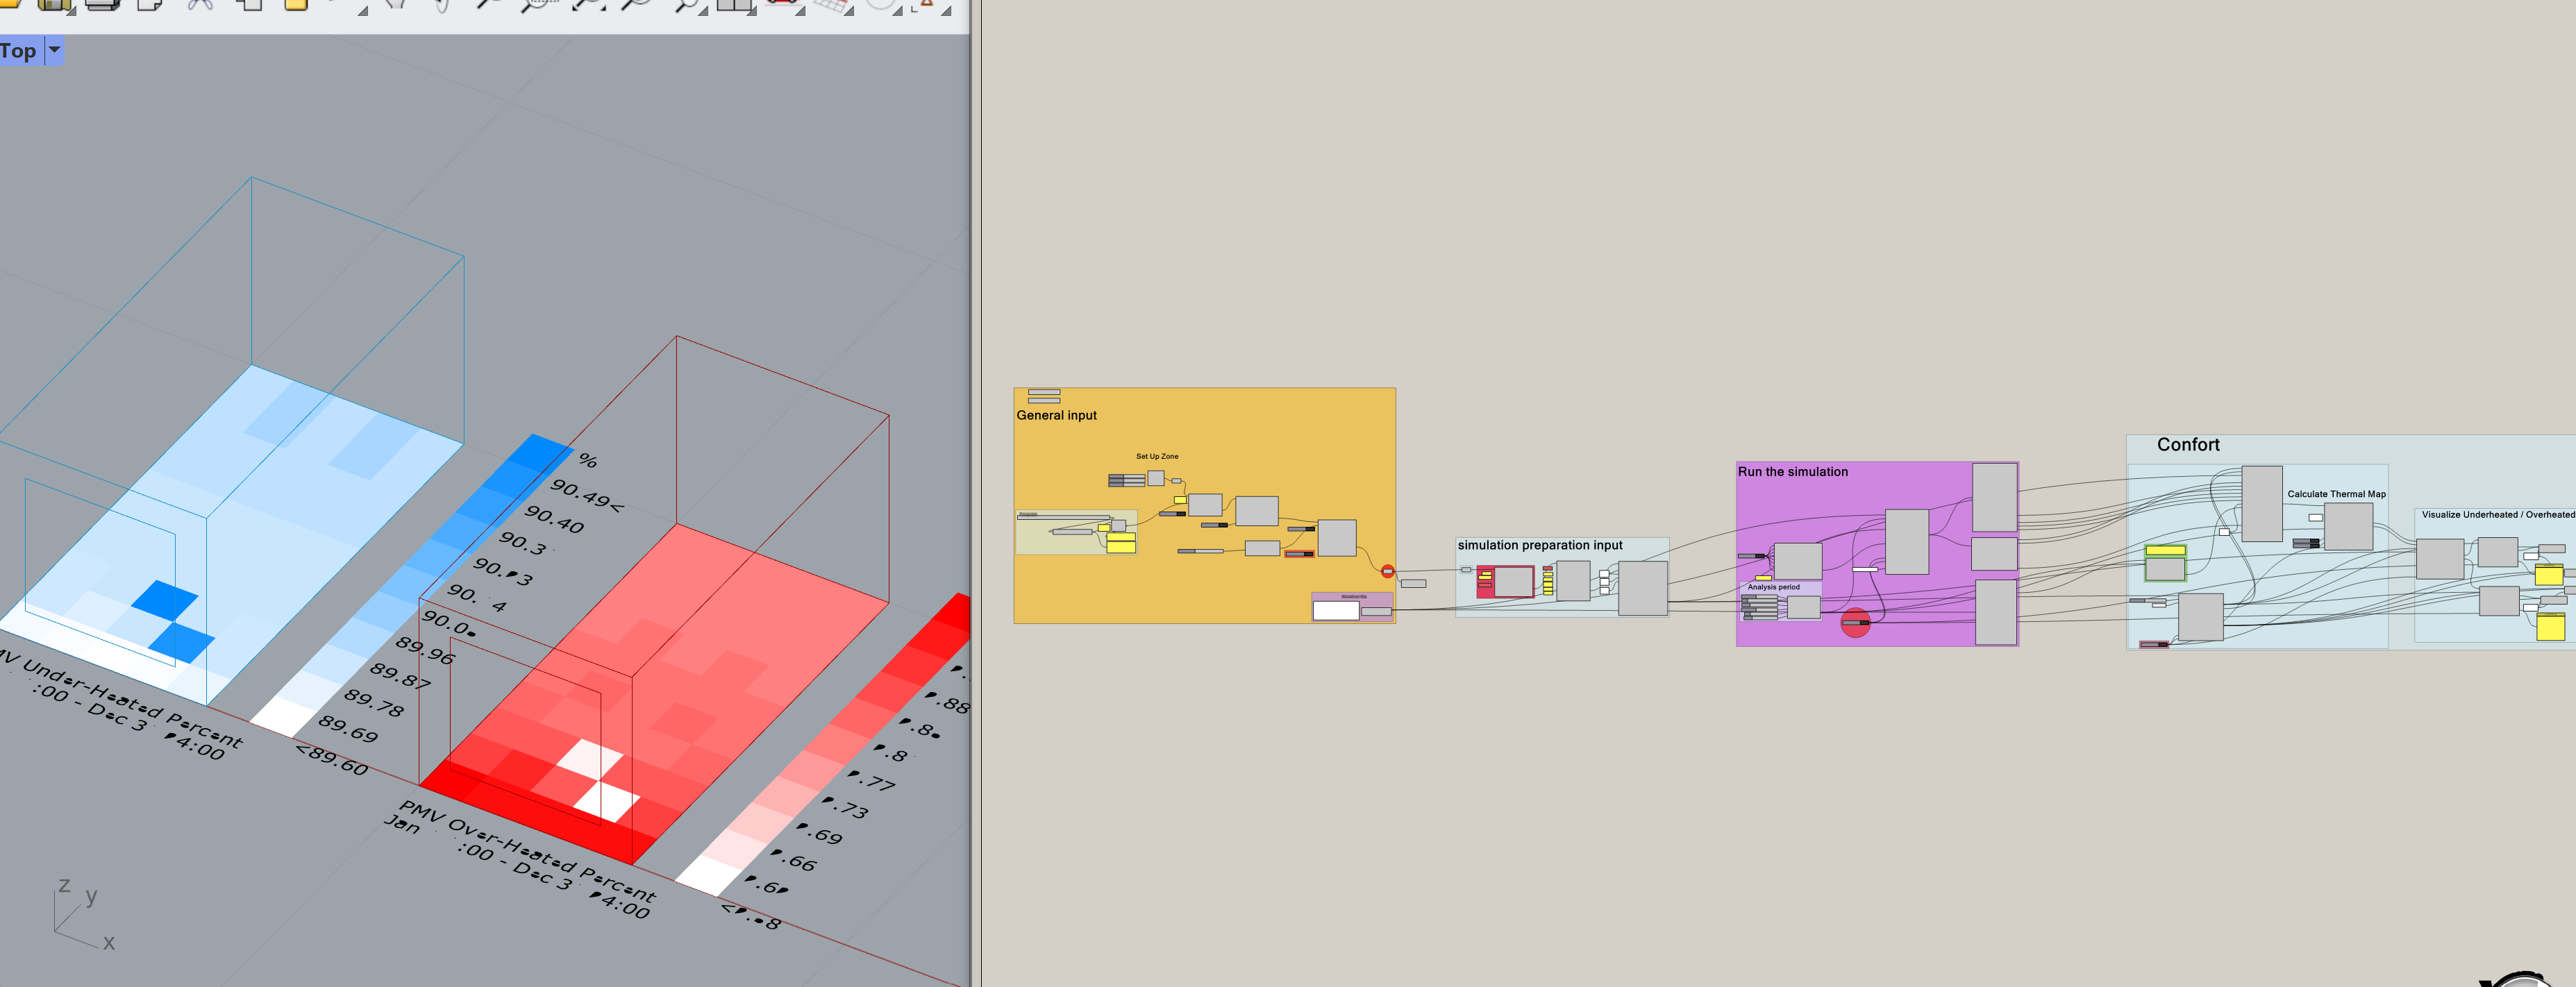
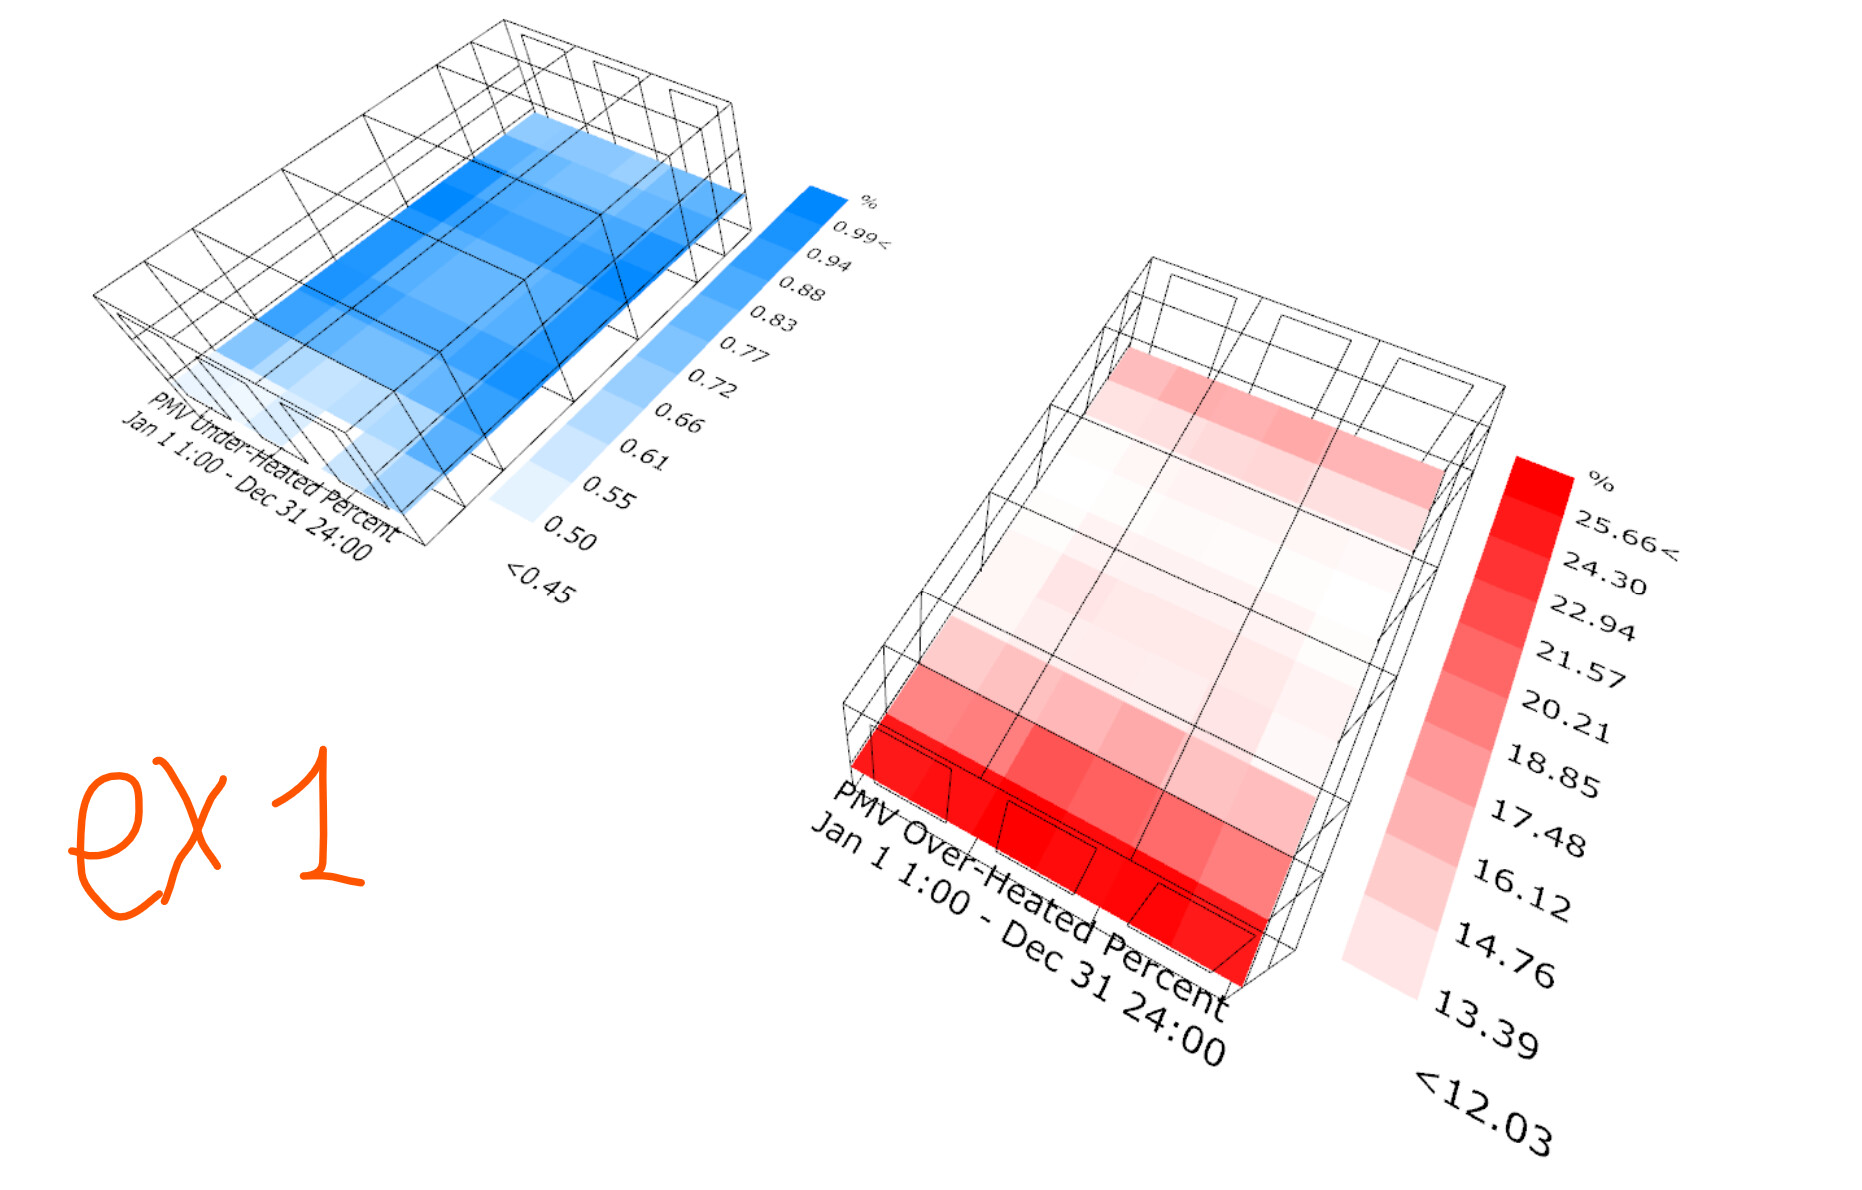
I am doing an analysis to obtain the annual Thermal Comfort Autonomy (overheating map and underheating map) for a shoebox office. the visualization (as shown in the picture below) is not homogeneous, I am talking about that should be degradation of the color map depending on the window.
I have no error messages! so I couldn’t find where is the problem
I will appreciate any help.overheating and underheating.gh (736.8 KB)
I don’t think it is the OS version. What i see in the blue map is that the whole scale range is less than 1 oC. I would say that what you see is in the “acceptable” margin of error. Just looking at the colors is not enough. The legend of the red map is impossible to read.
-A.
I am pretty sure it’s because you put your test surface right at the floor level and some of the points are falling inside the room boundary while others are falling outside (giving you outdoor thermal comfort for these points). I recommend moving your test surface to the typical center of gravity of a seated person (~0.8 meters off the floor).
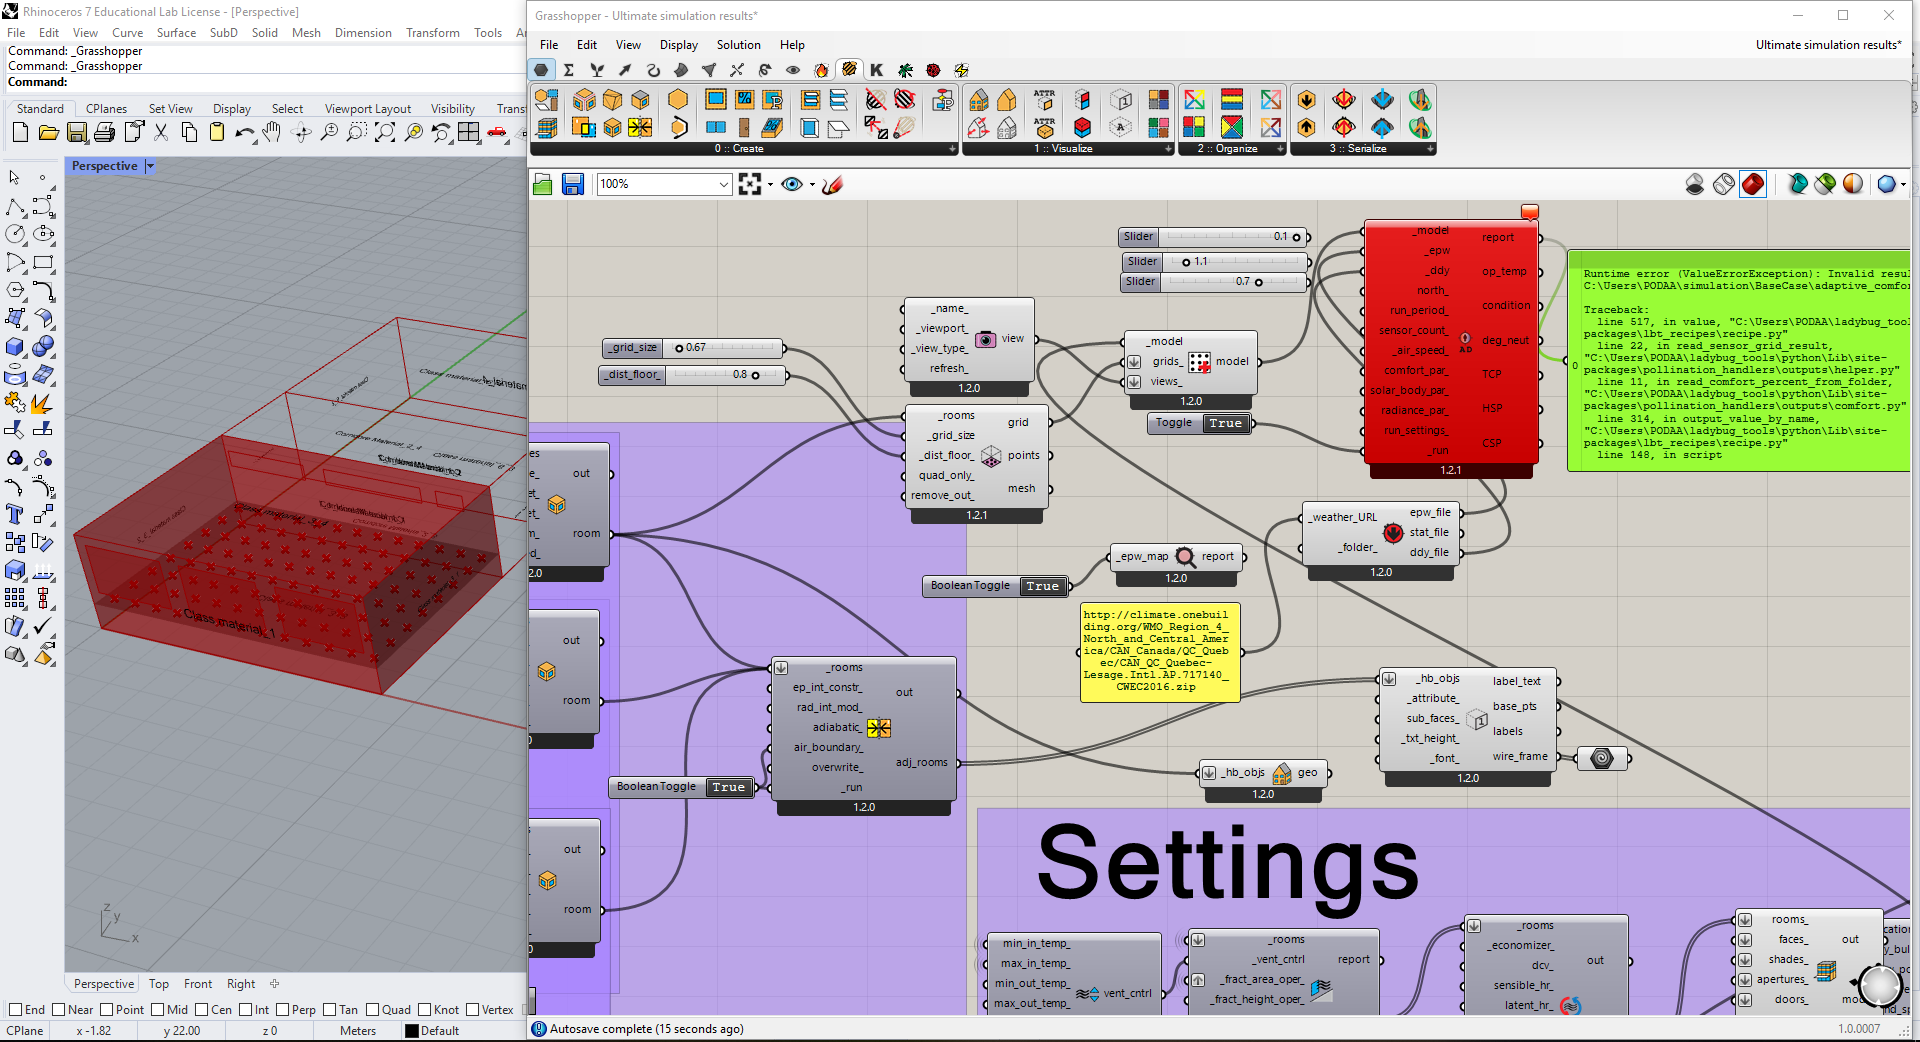
Hello @chris , I stumbled upon an error when i would like to present thermal map. Thank you for your recent stunning updates.
Runtime error (ValueErrorException): Invalid result folder: C:\Users\PODAA\simulation\BaseCase\adaptive_comfort_map\metrics/TCP
Traceback:
line 517, in value, “C:\Users\PODAA\ladybug_tools\python\Lib\site-packages\lbt_recipes\recipe.py”
line 22, in read_sensor_grid_result, “C:\Users\PODAA\ladybug_tools\python\Lib\site-packages\pollination_handlers\outputs\helper.py”
line 11, in read_comfort_percent_from_folder, “C:\Users\PODAA\ladybug_tools\python\Lib\site-packages\pollination_handlers\outputs\comfort.py”
line 314, in output_value_by_name, “C:\Users\PODAA\ladybug_tools\python\Lib\site-packages\lbt_recipes\recipe.py”
line 148, in script
hello,
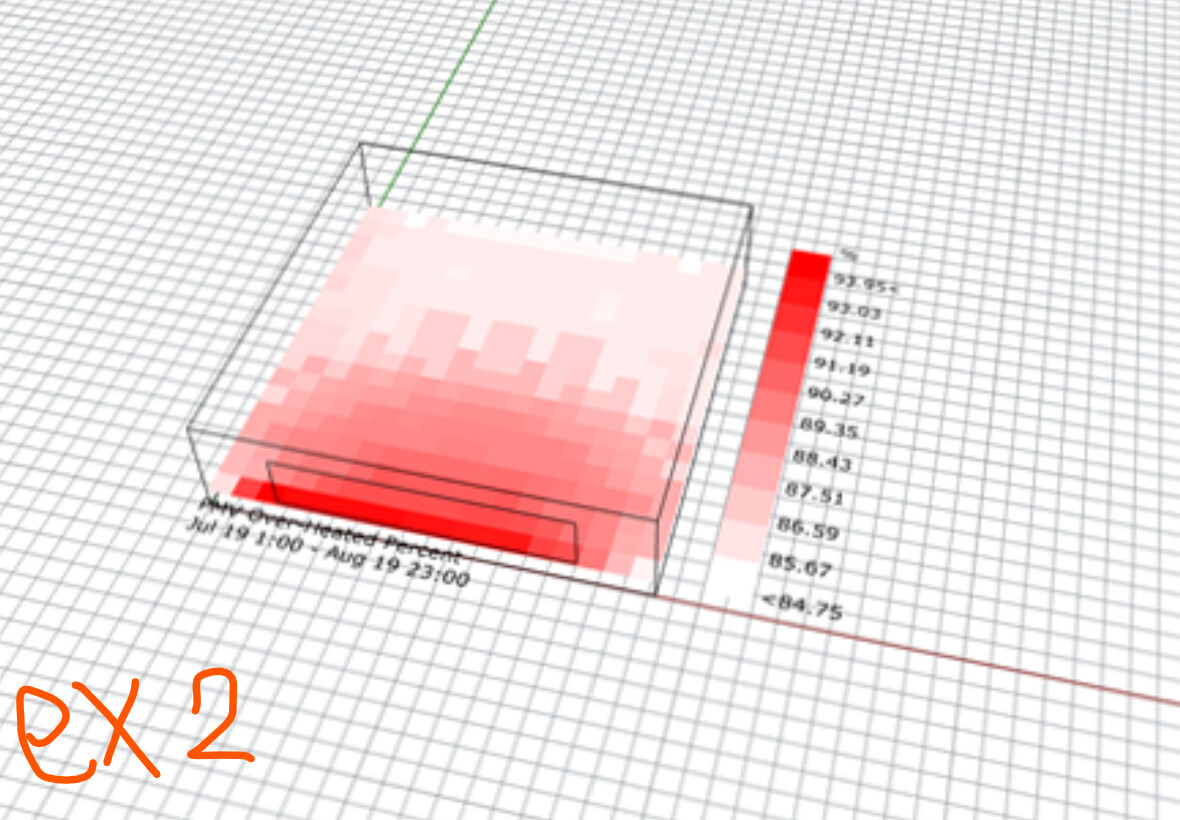
I am still having not homogenous indoor comfort maps, even when I modify the grid level.
when I am talking about homogenous I mean like the two examples photos attached (taken from other examples)
I don’t know if it can be considered in " the acceptable margin of error" as mentioned by @AbrahamYezioro
I’m not sure what is it that you see in the last posted images. They look “fine” by me. You can show the maps hour by hour and see if they make sense at this time step. What you see in the images above is the summary of the analysis period, which is good, but hard to use/implement in the design.
-A.