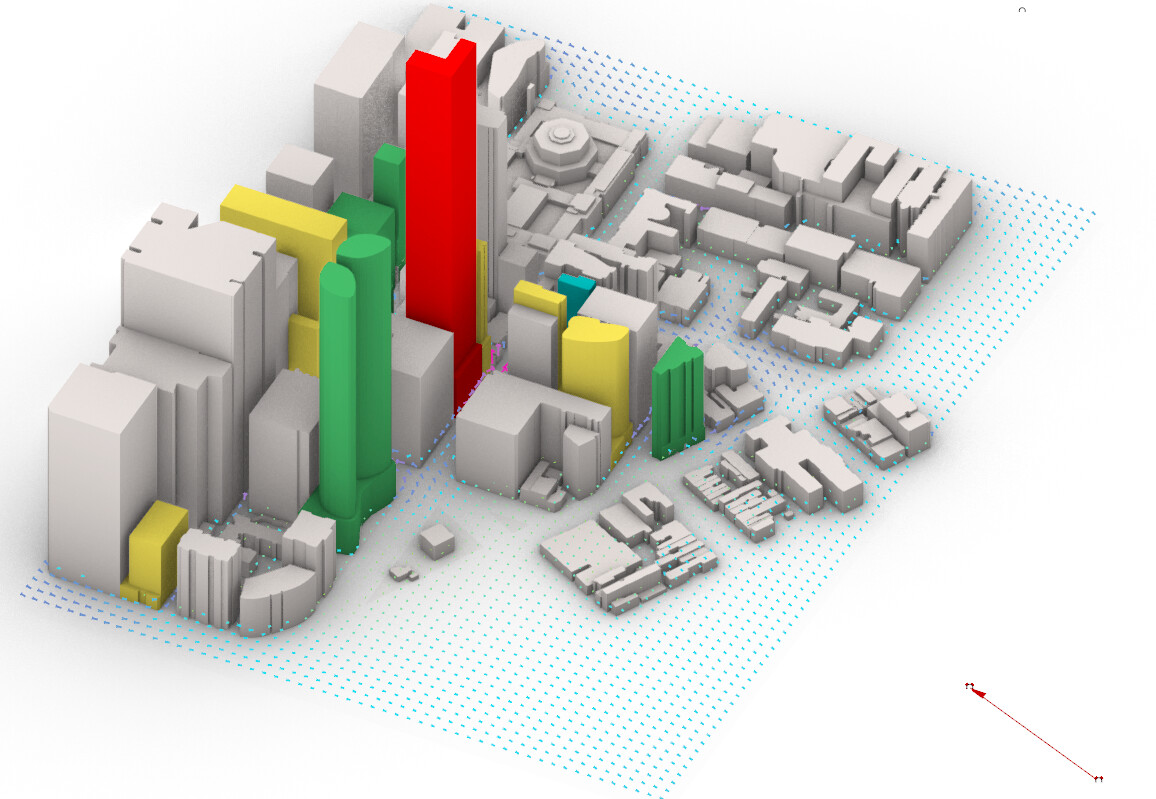
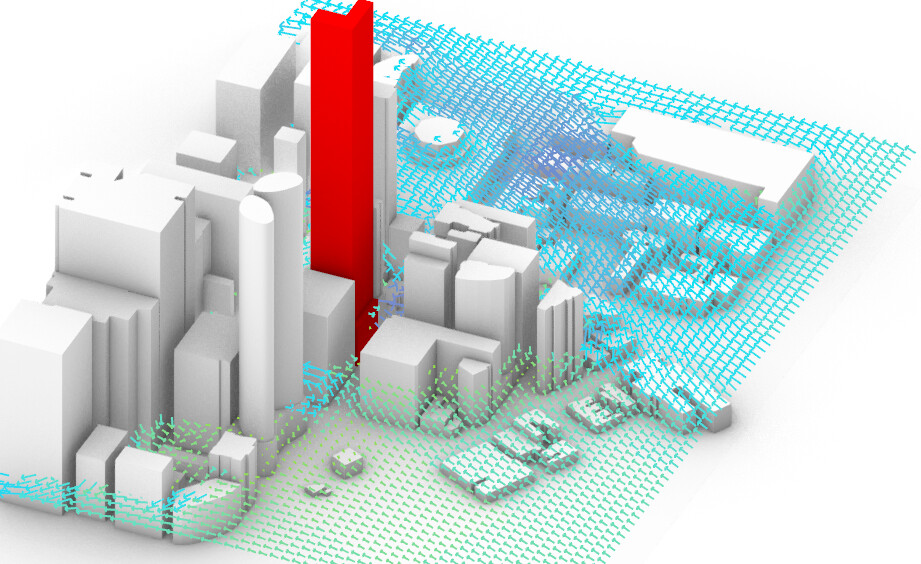
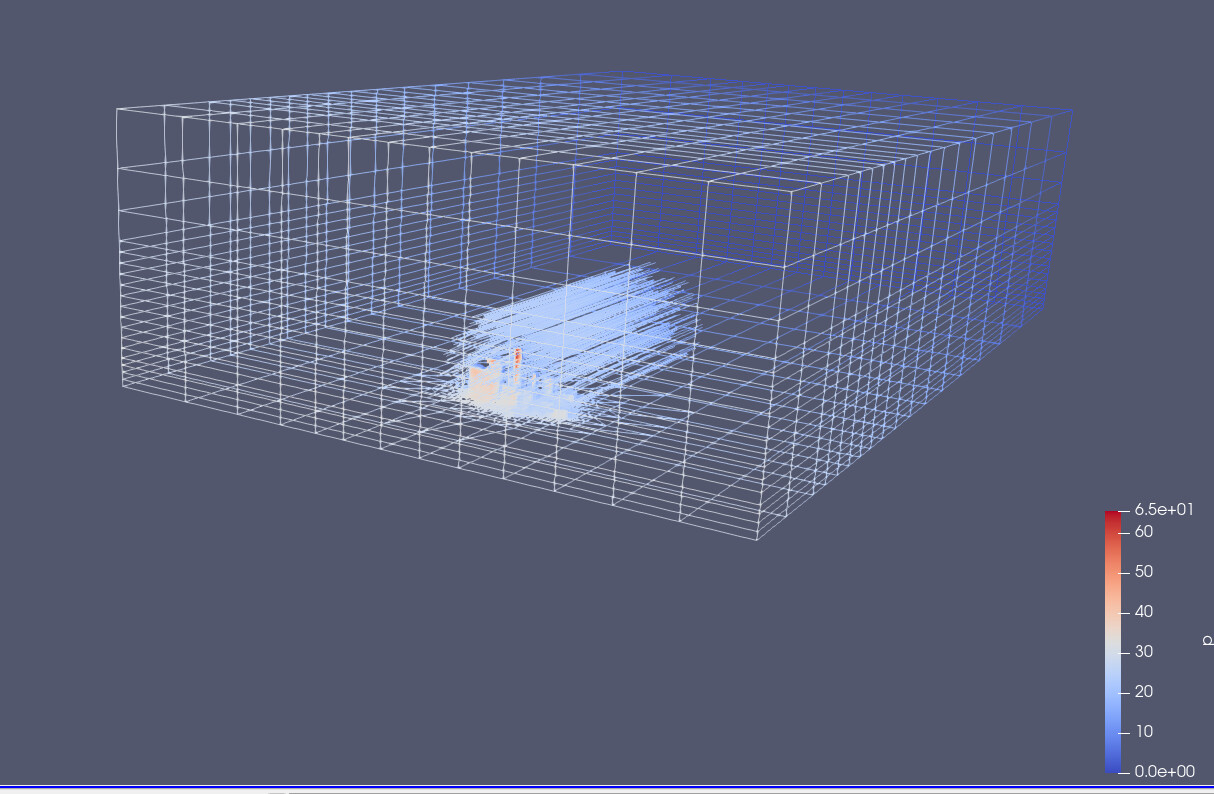
I’m running Butterfly to have inside house wind simulation.
But I don’t clearly understand what is time in butterfly. As I understand that it is not physical time.
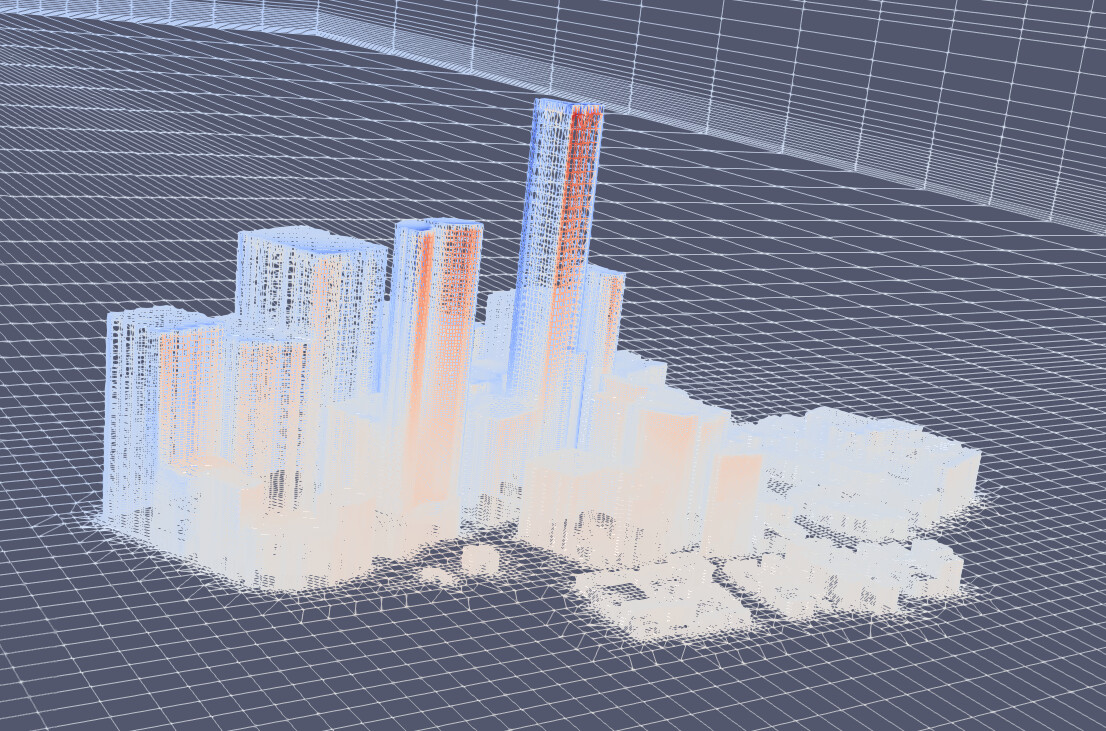
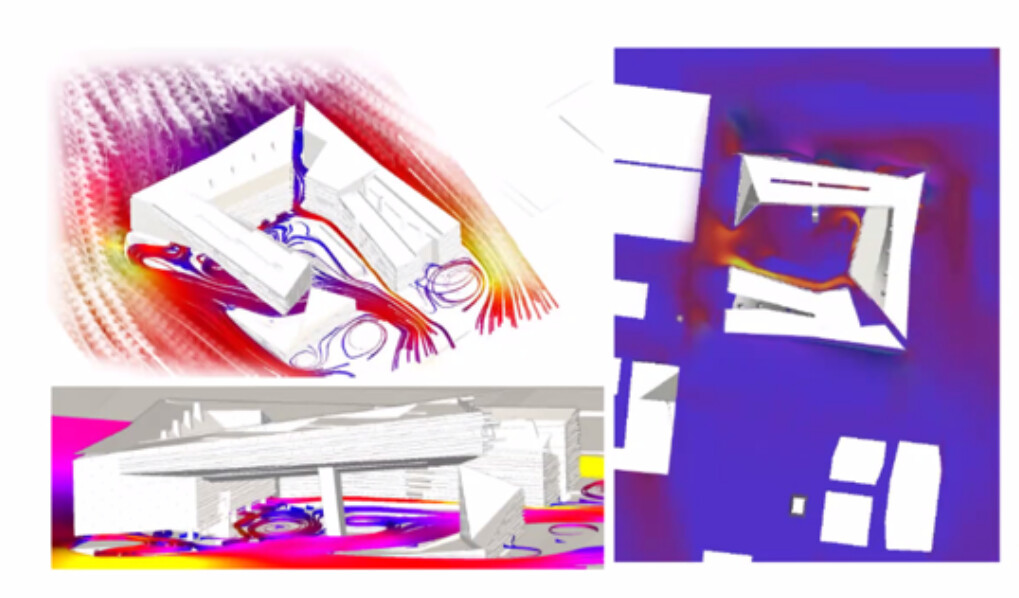
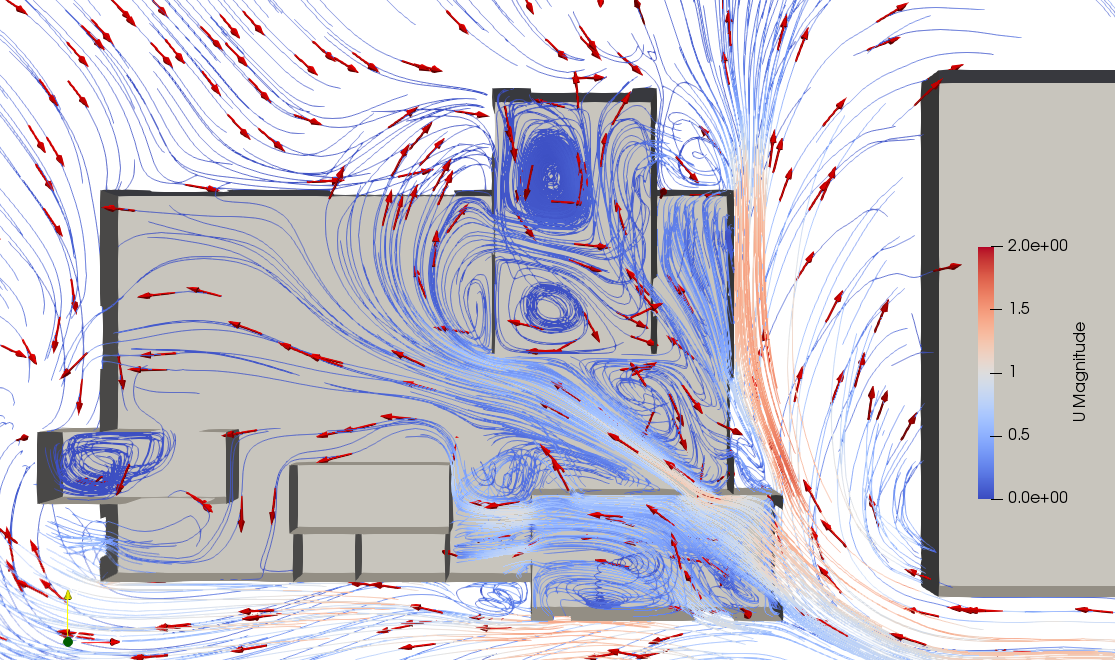
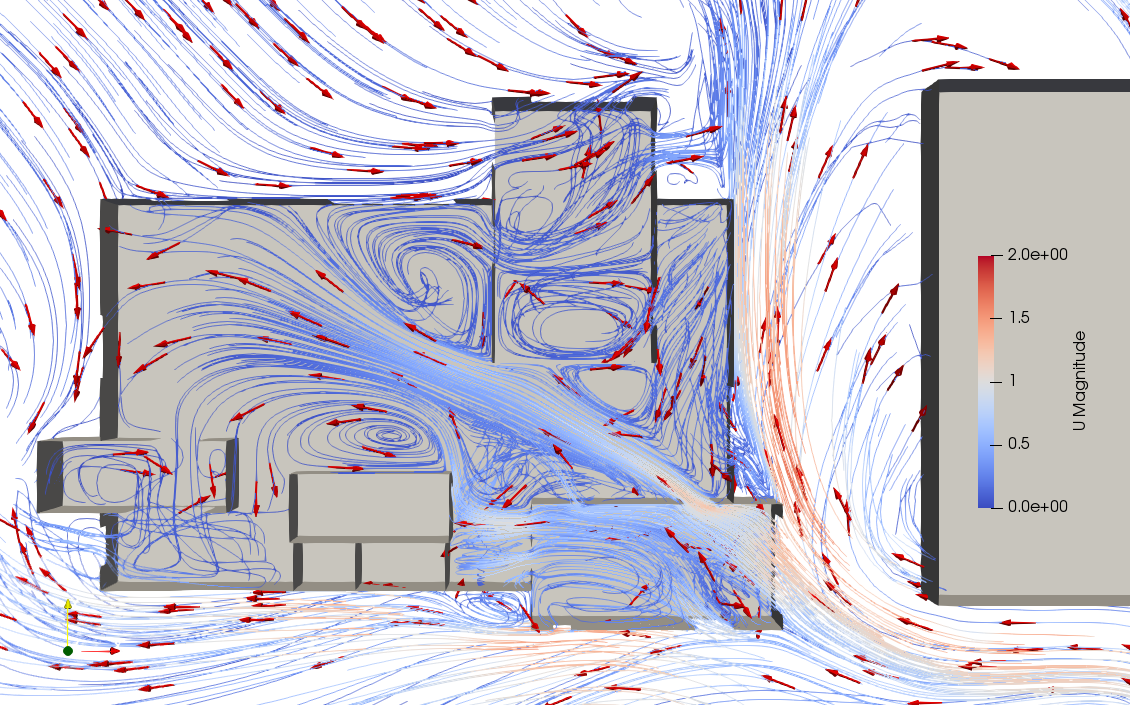
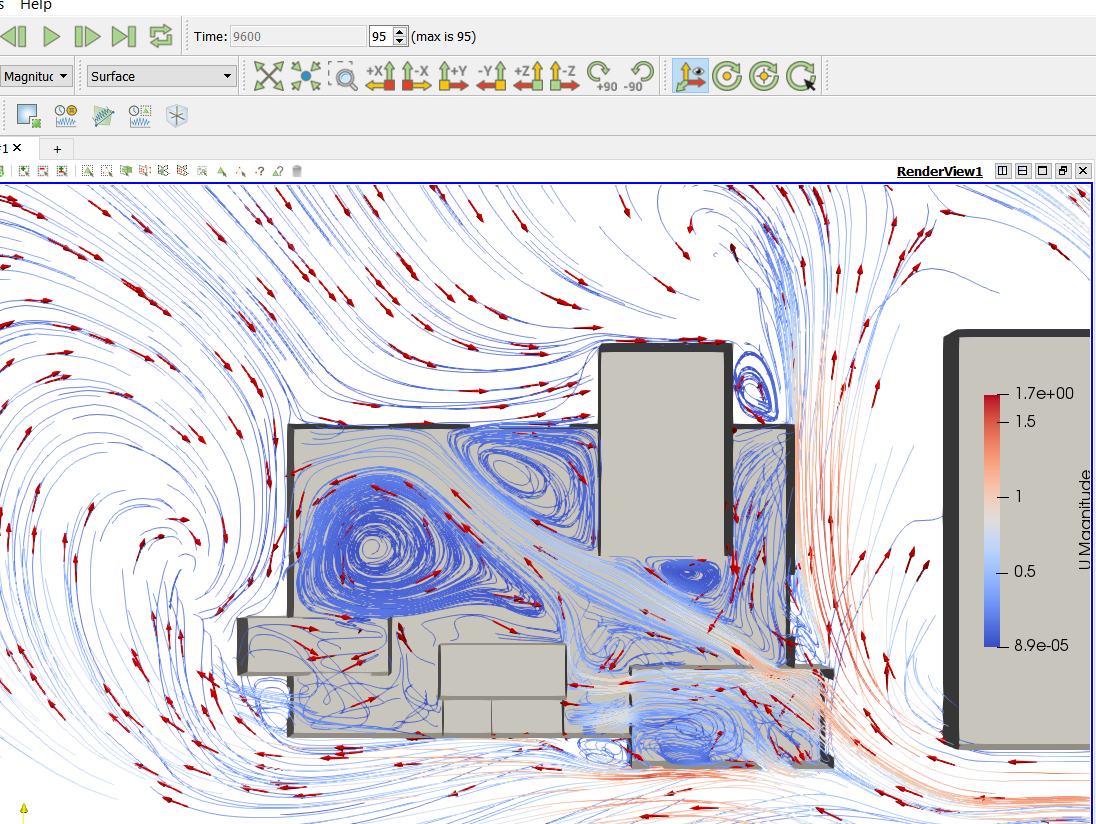
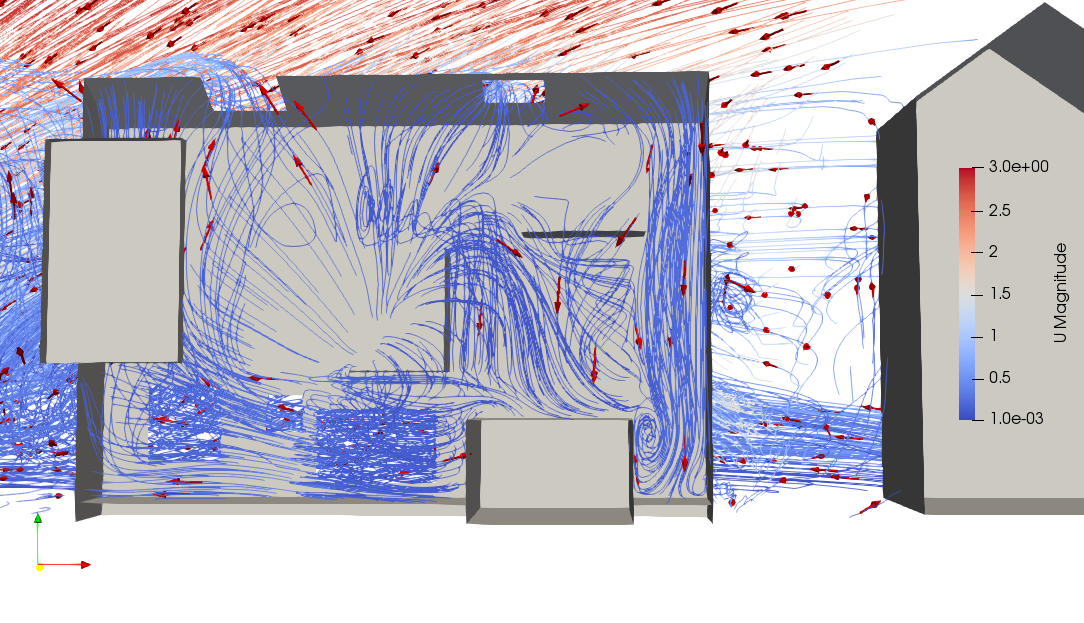
You can see in the pictures. The first one is the streamlines at time: 200 and the second is time :600 and the last is 1000
I’m so confused which is timestep I should stop. Could I convert this to the real time? Or how long I should run simulation (endtime in controldict)
Sorry for this kind of newbie quetion and my english. But hope someone can understand and explain for me that.
Thank you,
Thanks for posting. The simulations we are currently supporting in BF are steady state simulations. In the simplest words, this means that BF, through OpenFOAM, solves the same moment in time over and over again, hopefully approaching a converged solution as it does so. Your pictures therefore represent the same moment in time, but with different accuracy in respect to the parameters calculated (pressure, velocity, turbulence, etc.).
There is no typical number of iterations you should run, as this varies from case to case. I would suggest you wait until the residuals reach at least 10e-4 before stopping the simulation. BF/OF will do that for you automatically if you just let it run without stopping, that is if your solution is converging. Another way to decide when to stop is when the value of a parameter you are monitoring stops fluctuating. This is not yet implemented in BF components but you could do it on your own by using e.g. a probe and monitor the values of pressure or velocity in points of interest. A typical kind of algorithm might be “stop simulating when the value I’m monitoring hasn’t changed more than 0.001 in the last 500 iterations”. Or something similar if you’re not interested in that much accuracy.
My typical urban simulations will run for about 5000-6000 iterations, but I don’t think you need that much for a simpler case or for an instance where you are just testing various scenarios.
is the correct wind simulation inside the house and I should use the U and p value from that.
So I made a mistake when I thought these streamlines follow the time: in 1 or 2 seconds the wind vector will follow the streamlines as picure 1 (P_200), then next 3-4 seconds the wind vector as picture 2 (P_600) and so on…
Thank you to pointing out.
Could you answer for me two more question? ( It’s not relate to BF but hopefully you can help me to solve them)
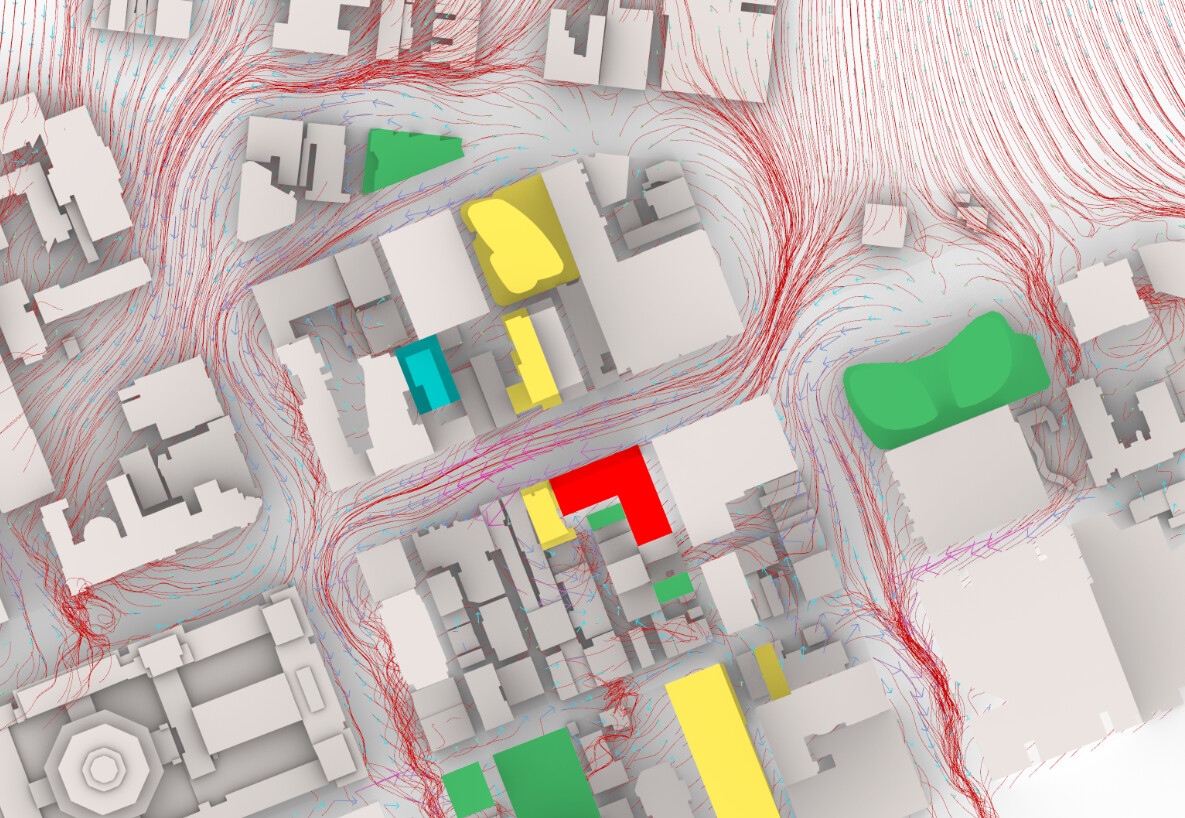
My siuation is find the best option to open/close the windows to have good ventilation.
So my stratery is:
Run will full close to clarify the higher and lower p.
Open the window at that area
Run a few simulations with different options (window close/open) to track the wind vector.
Finally, I have to evaluate the result.
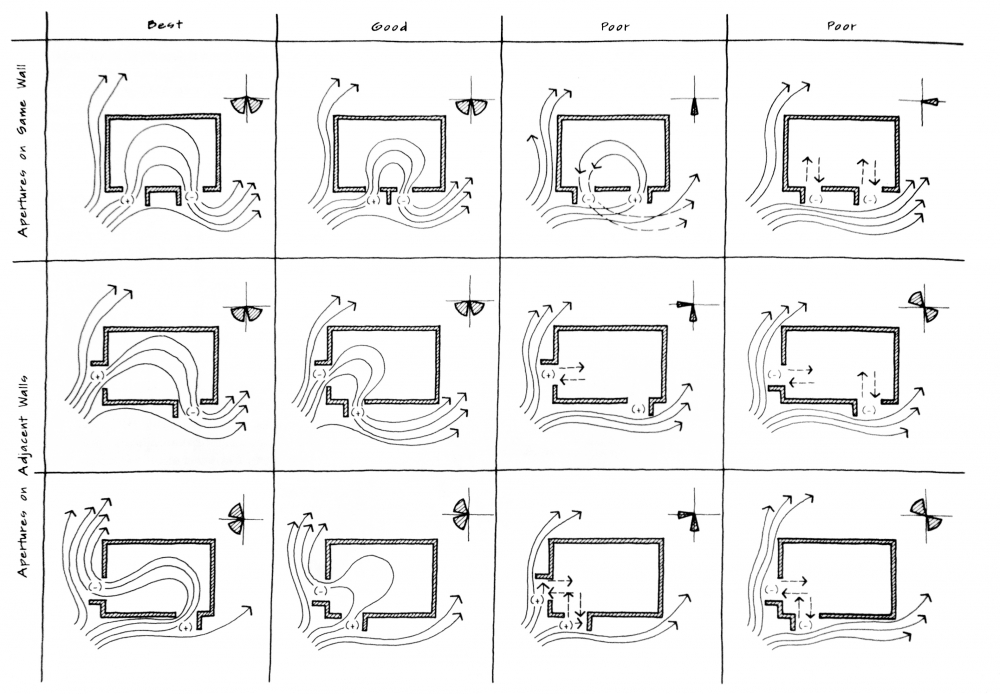
At first I thought that It’s simple like picture 1 (P_200) or like (Image from Sun, Wind, and Light, p. 184 by G.Z. Brown and Mark DeKay, published by Wiley)
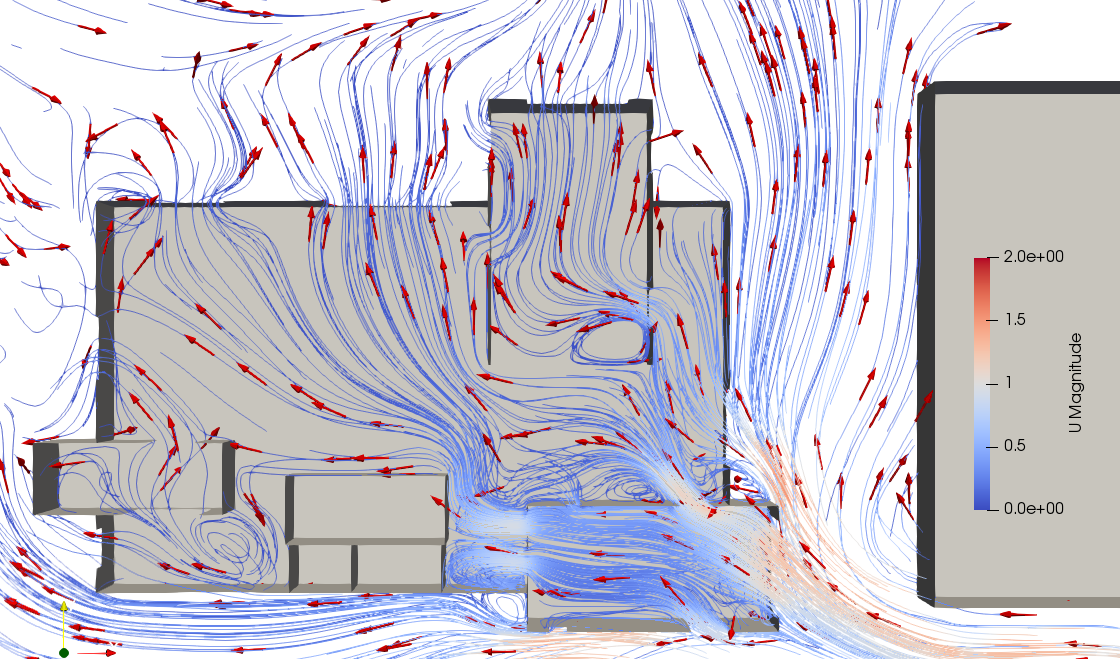
It’s hard to understand how does the wind run inside the house when it blows.
Do you have any suggestions for my case? How can I evaluate the good option?
Well your model is a bit more involved than those hand drawings. You can try doing a couple of things.
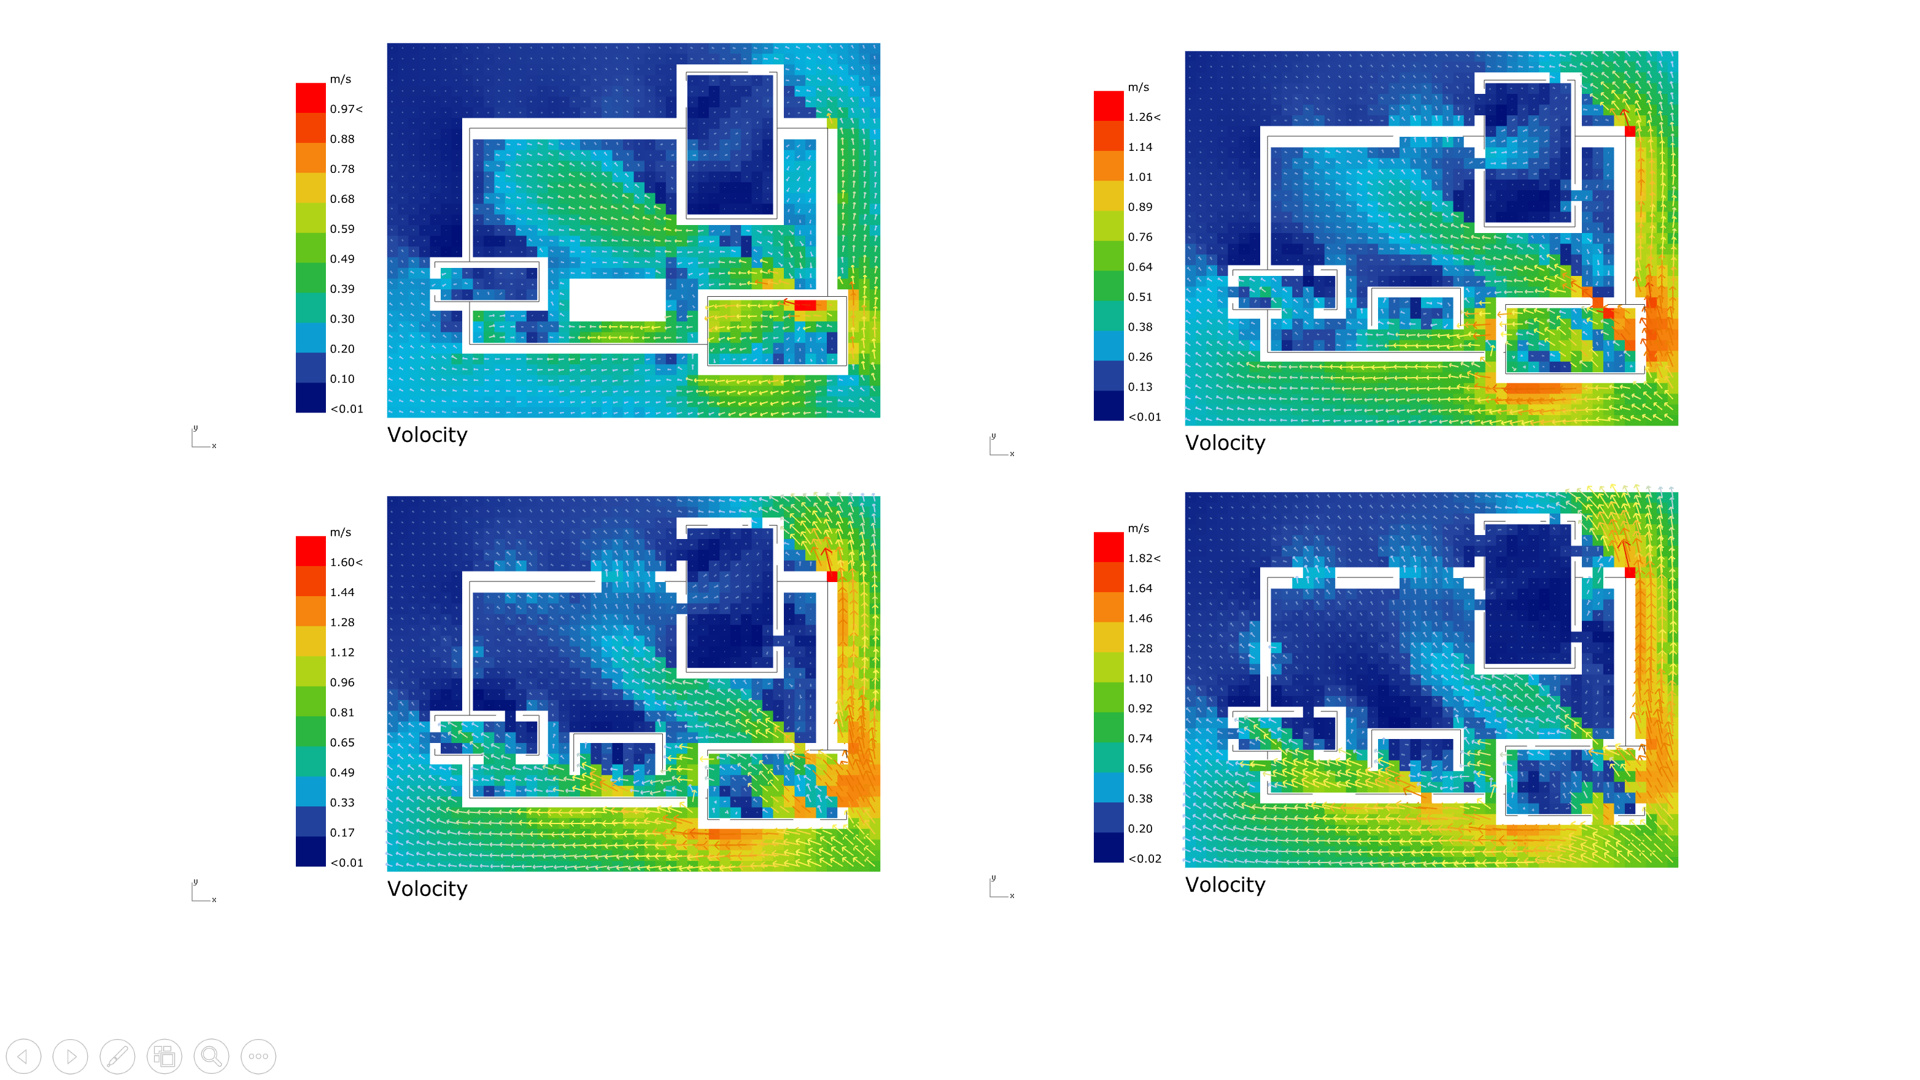
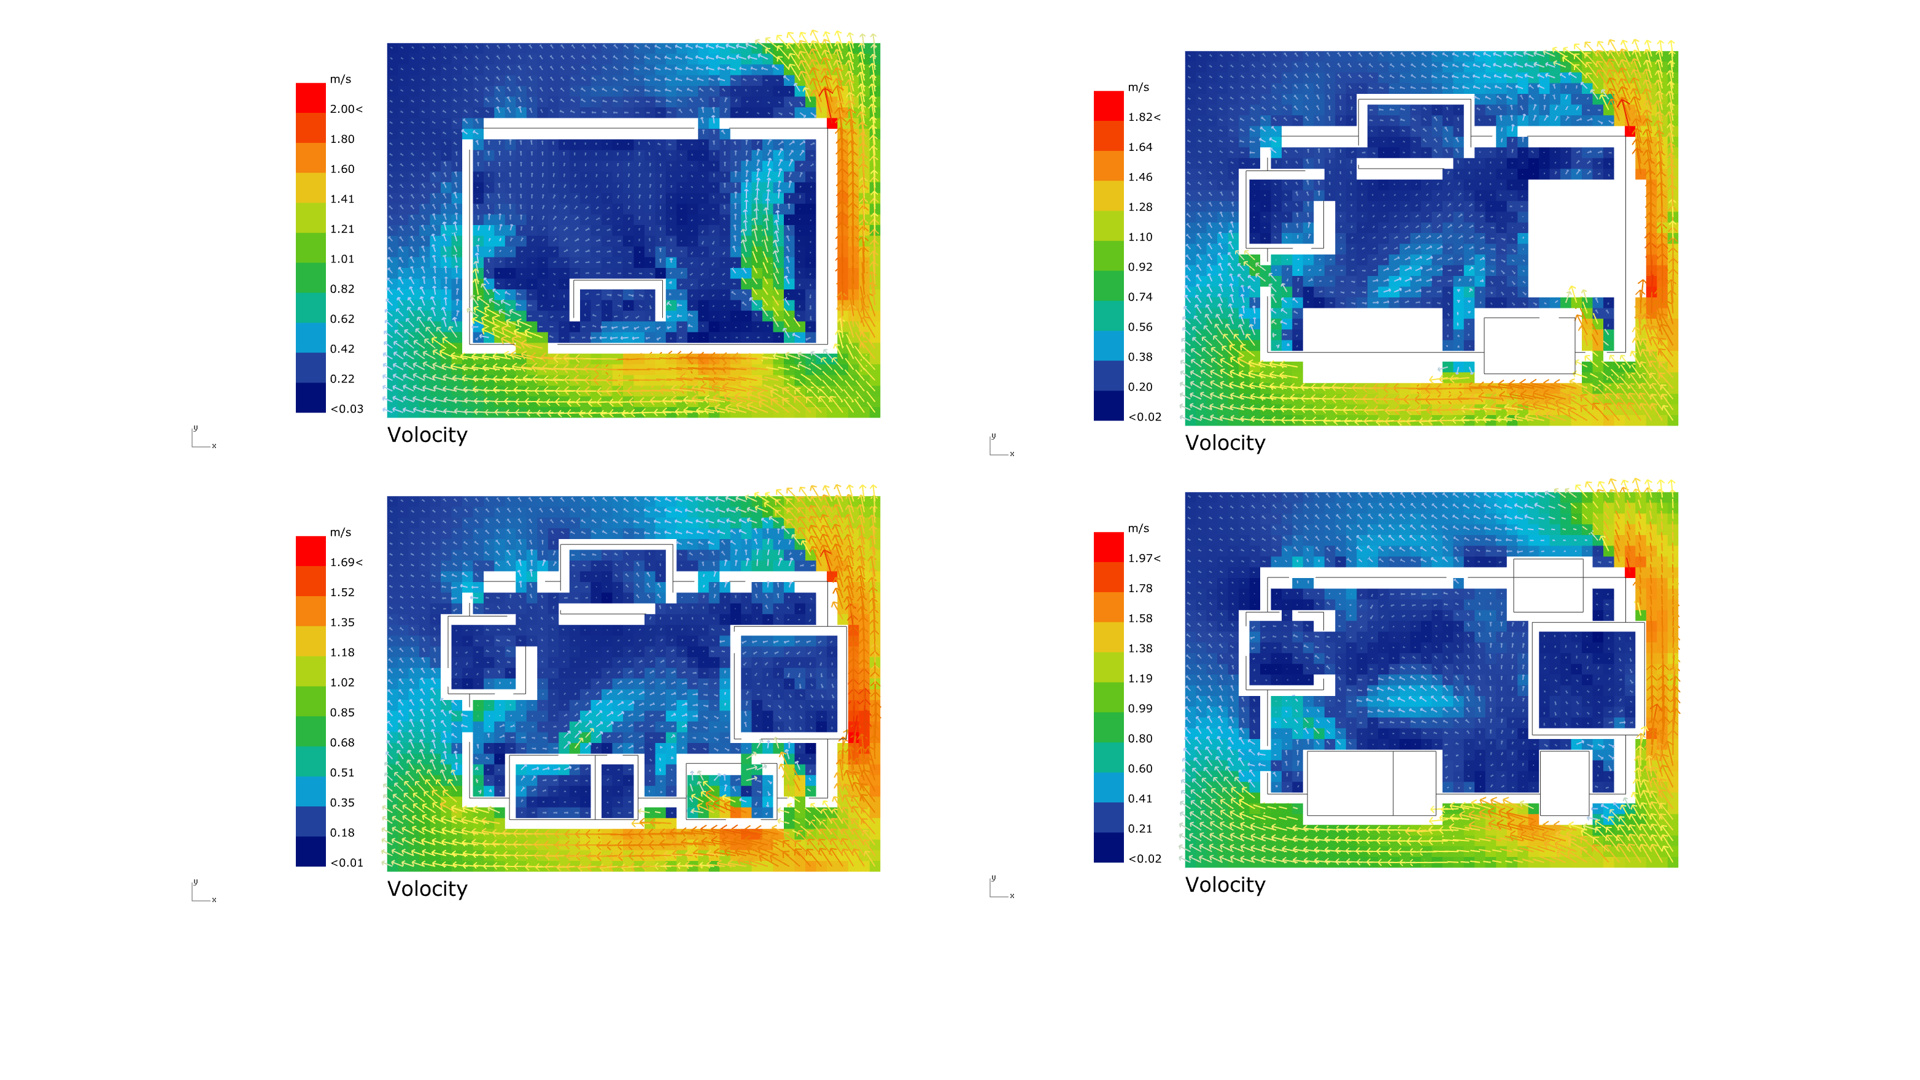
a) I think it will be more helpful for you to visualize a velocity plane instead of streamlines. It will show a clearer image of the wind patterns inside the house and the (potential) NV and cross-ventilation patterns. You can do that with a probes component (see b), as it is in the example file I believe.
b) Additionally, you could assess the area-weighted average velocity at a height above your floor (e.g. 1.2m). You can do that by creating a surface there, using HB’s grid component to create points, plugging the points to the probe component and calculating velocities at these points. Remember if the velocity is a vector, i.e. x,y,z, then you need the good old high school math: magU = sqrt(U_X^2+U_Y^2+U_Z^2). Then all you do is an area weighted average. The higher that average is the better NV inside the room.
I think those two things should be enough to get an intuition (a) and a parameter to optimize (b).
The space that I want to check NV is a atrium and the plan changes the shape from level 1 to 3. Should I average the 3D volume inside this space or 2D (the plan at 1,2m) is enough?
The easiest way is to use the software paraview. You can load in there the foam model generated thx to BF and then visualise the streamlines.
otherwise if you have you points and vectors you use the definition here below:
But I think that learning how to use paraview will bring you more detail results… (usually I mixing the two, rhino for visualisation and paraview to create the data)
You can go into the filters and select the “stream tracer” filter.
It’s a little bit tricky to use but it’s working well. You can export the data to go back to rhino but it is a little bit complex. Tell me if you need more info about that…
Hi lamvd, would you happen to have the file for this wind experiment that you could maybe share or provide any useful method or resource to help me analysis wind and its impact on internal spaces. It would be incredibly useful and I would greatly appreciate it.
 Would you by any chance know why?