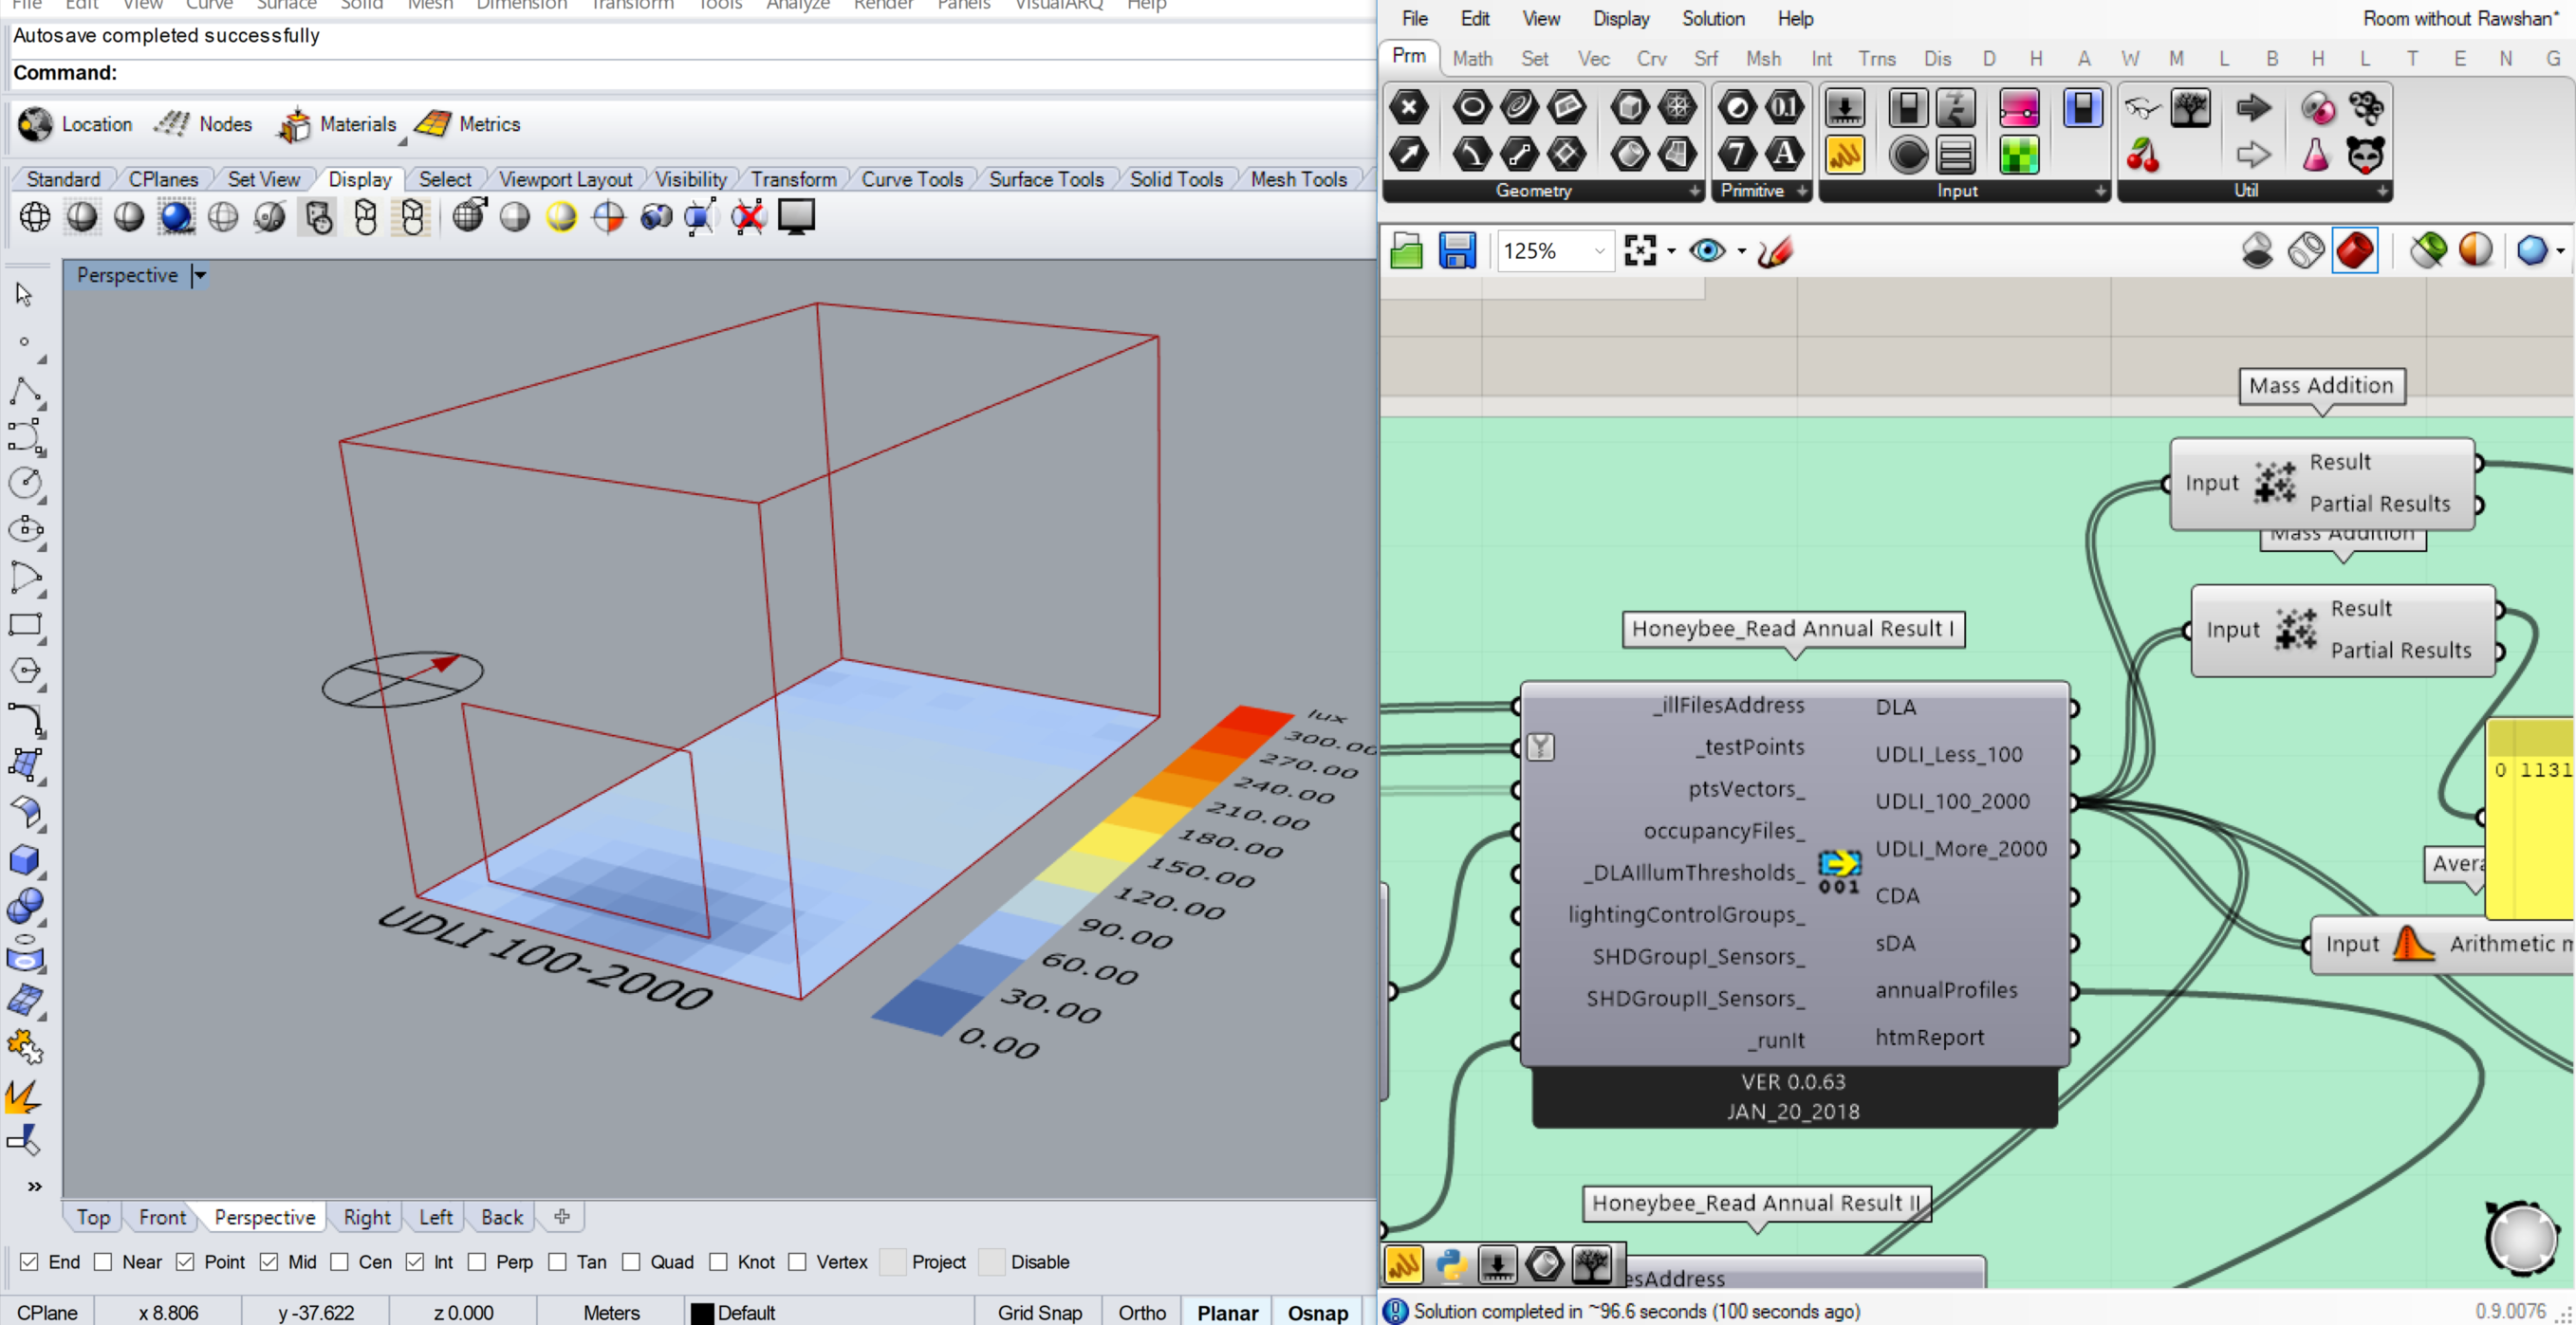
If you check the hint of the output you’ll see the following:
UDLI_100_2000: Useful Daylight illuminance > Percentage of time during the active occupancy hours that the test point receives between 100 and 2000 lux.
From this the answer for your first question is that it can be correct. Probably, in your case, the percentage of time over 2000 lux is very high. That’s why the percentage of time between 100-2000 is lower than at the back of the space.
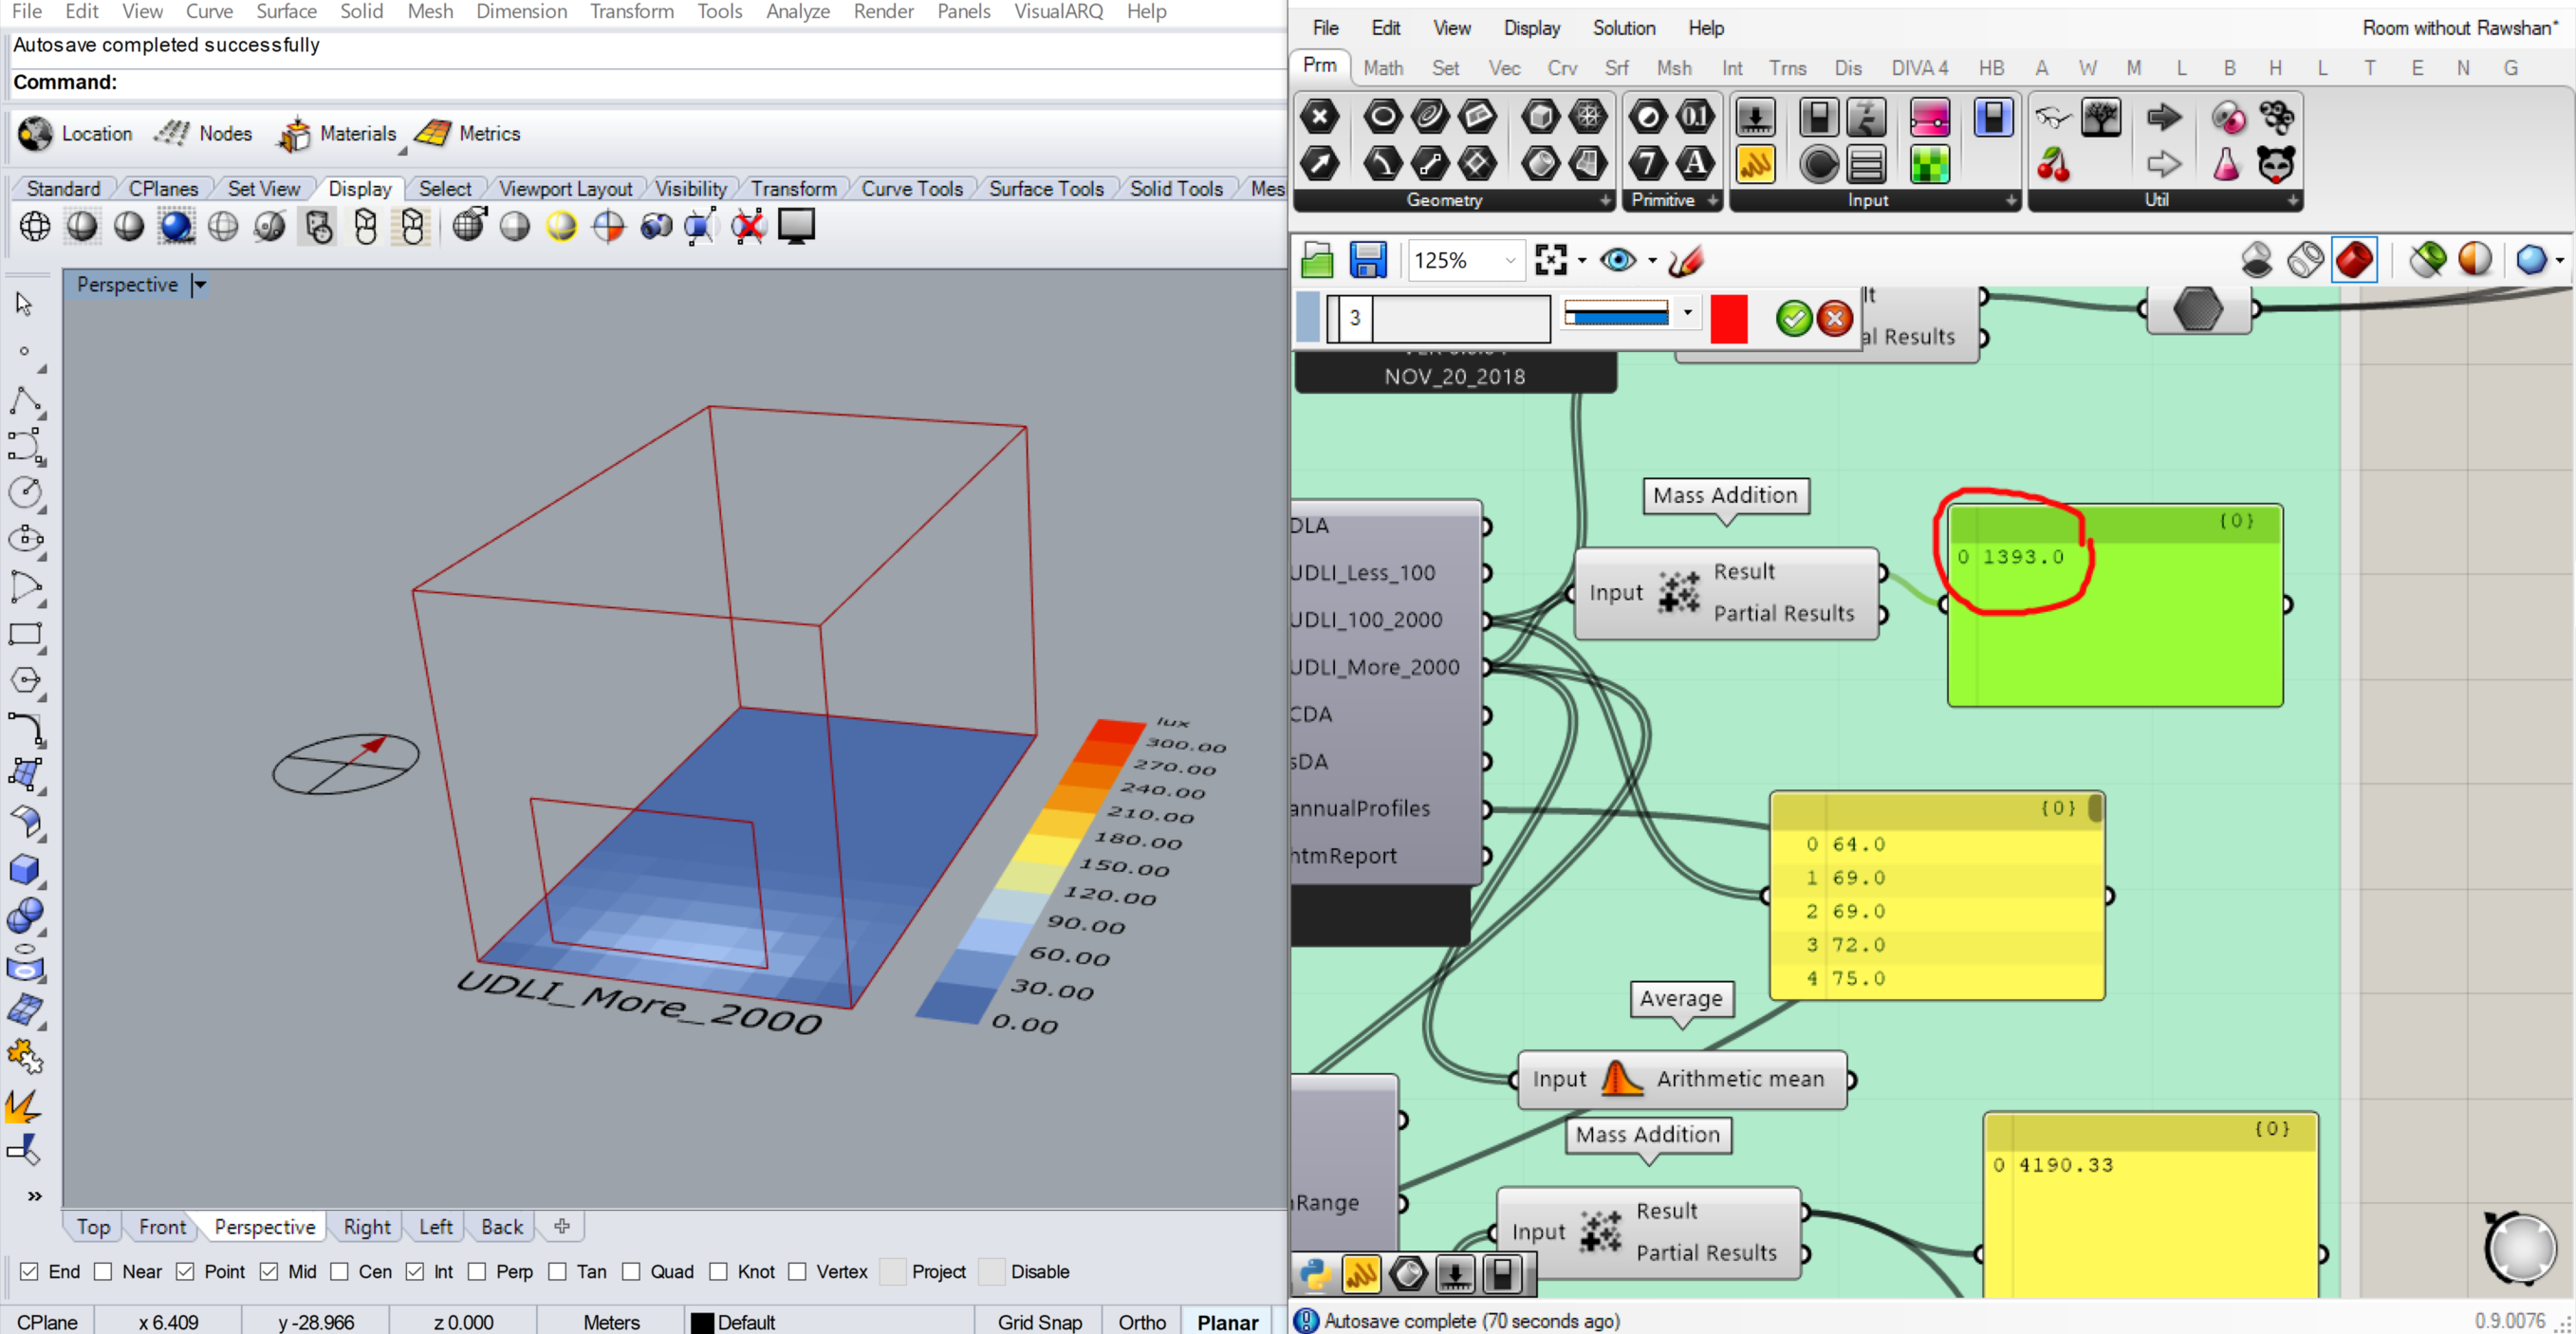
You are summing up ALL the results of the grid. This is wrong since you are adding percentages. This number is not good for you.
Also the color and legend are wrong (you see title LUX). You probably connected a legendPar to the recolorMesh.
I wont draw the conclusion you mentioned … I suggest to understand better the definition of the UDLI, what is it good for, etc.
-A.
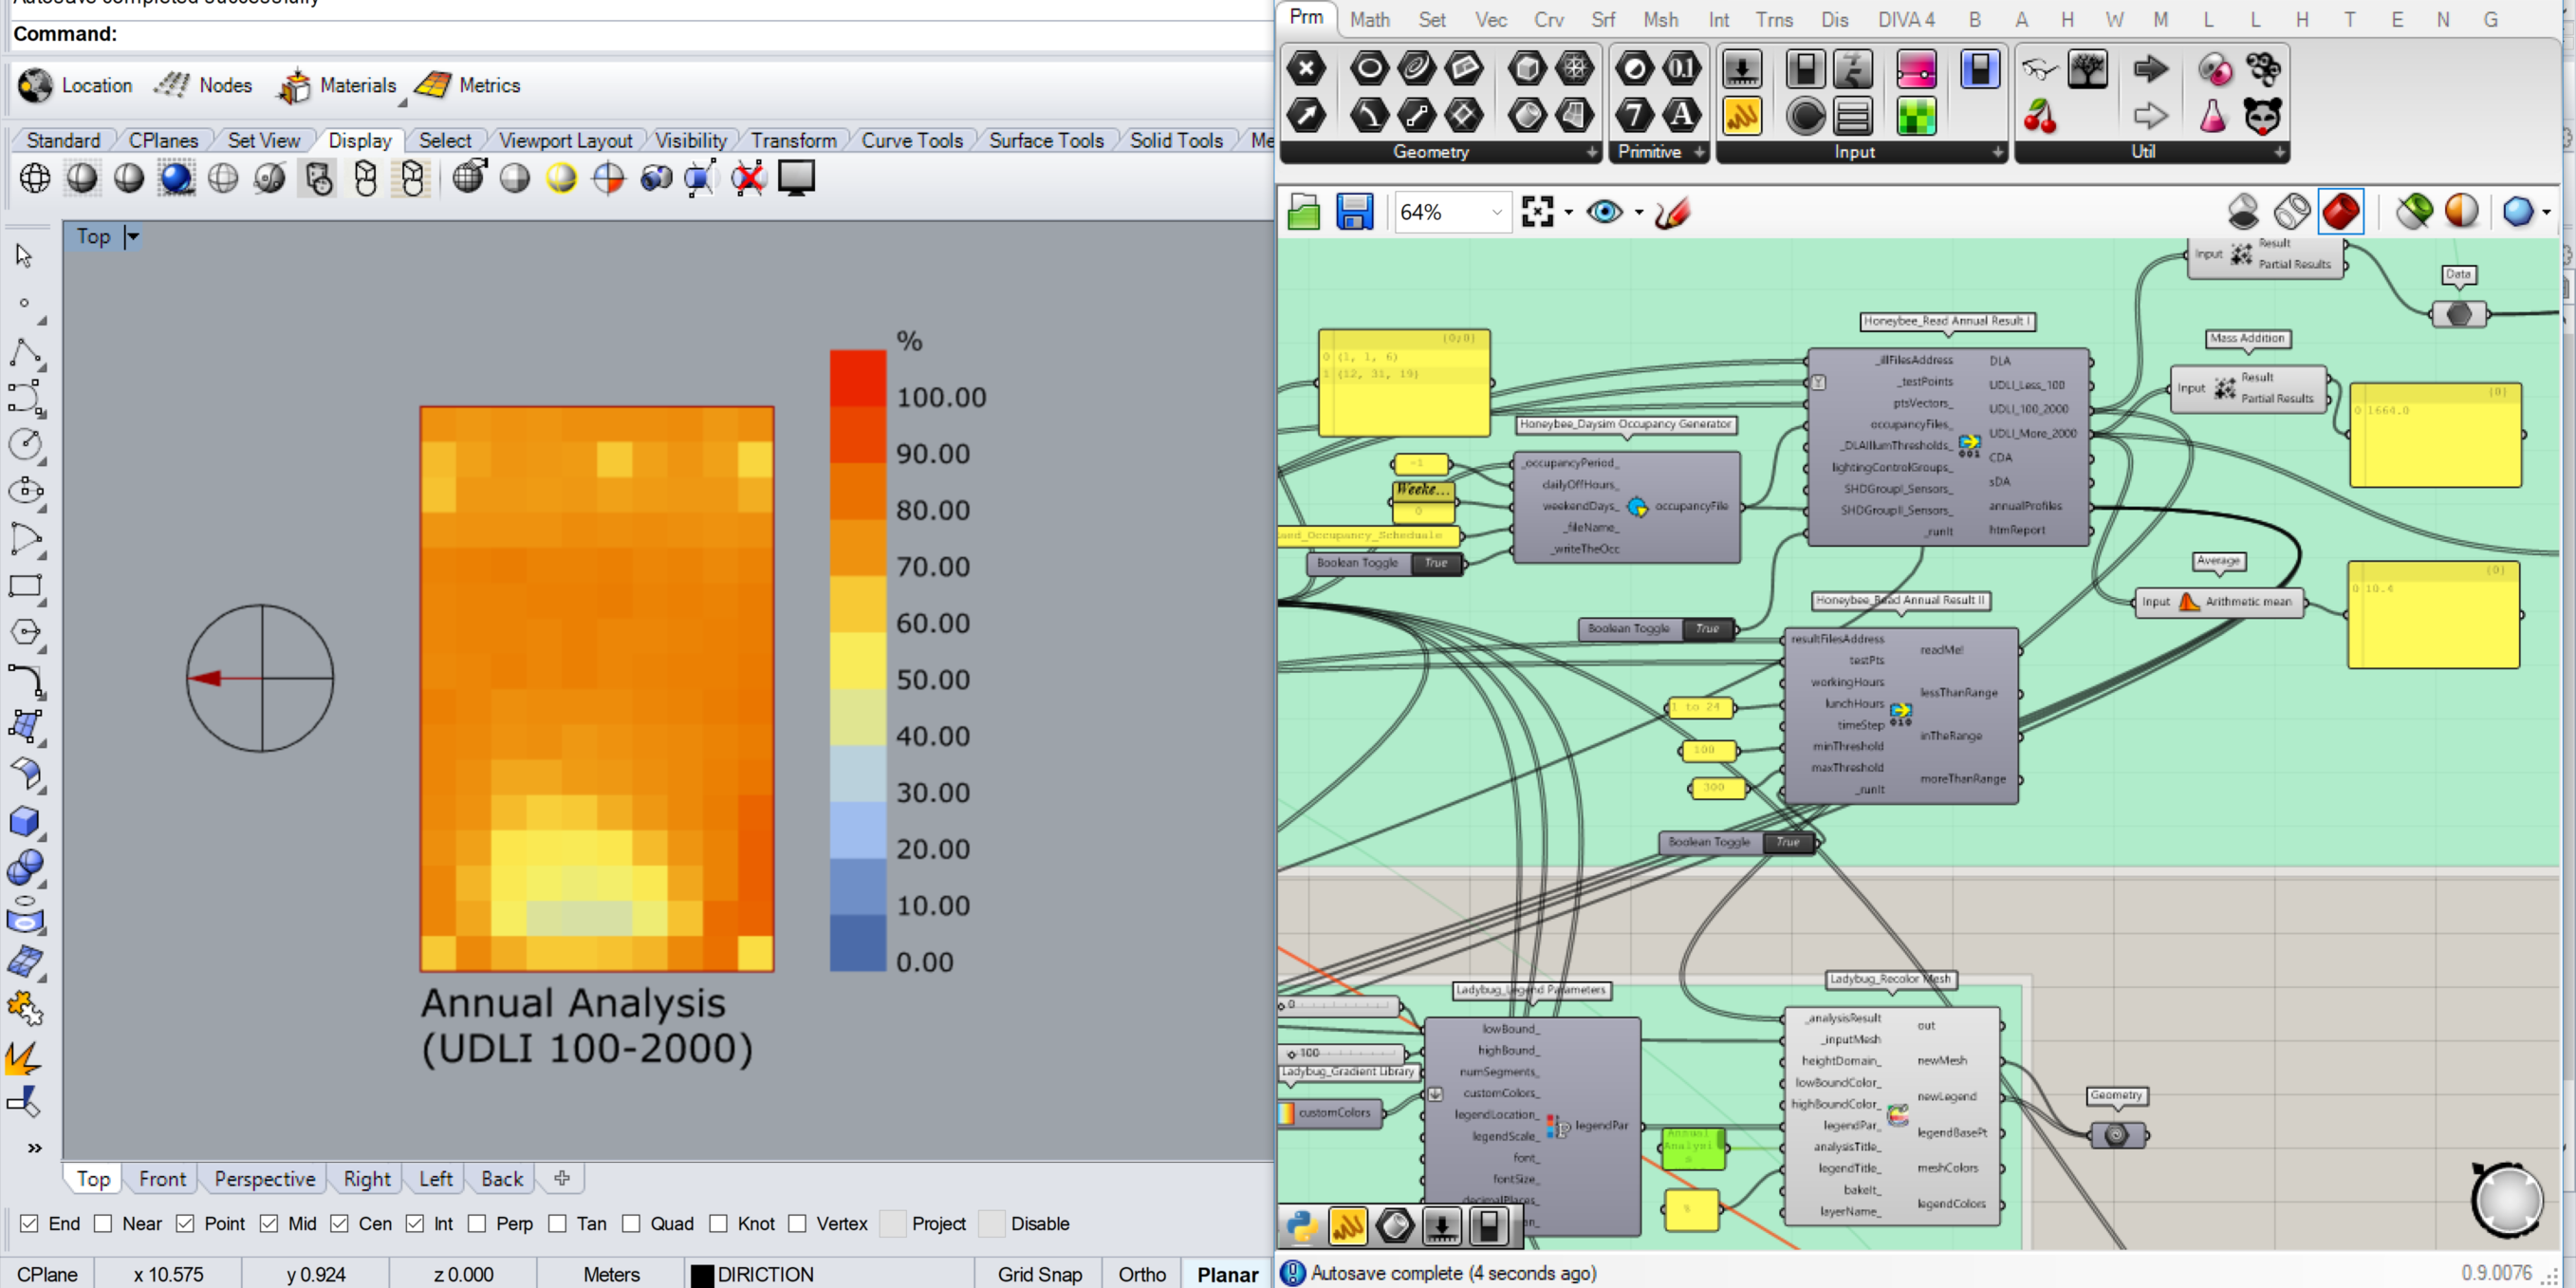
Do you mean it needs to change it to (%) instead of (LUX), and the LUX number to Percentage number?
I have read many articles regarding to that, and understood the difference between Daylight Factor (DF), Continuous Daylight Autonomy (DAcon) and Maximum Daylight Autonomy (MaxDA), Useful Daylight Illuminance (UDLI) and Daylight Availability.
I use UDLI as a mean metric because it has 3 ranges; UDLI<100 , UDLI 100-2000 and UDLI>2000. My case is a proposed living-room in a residential building.
My problem is I got many numbers from honeybee results!! How to calculate the percentage of darkness and the lighting in this space?
The UDLI is fine, then, for you. You can draw conclusions regarding where, most of the occupied hours, you have enough/not enough light, where there is a chance of glare. You can also try to change the shading conditions, depending on the results, so you not only say what is happening but you can also improve the solution.
-A.
I applied a shading device front of the window to improve the daylight meanwhile decreasing the energy.
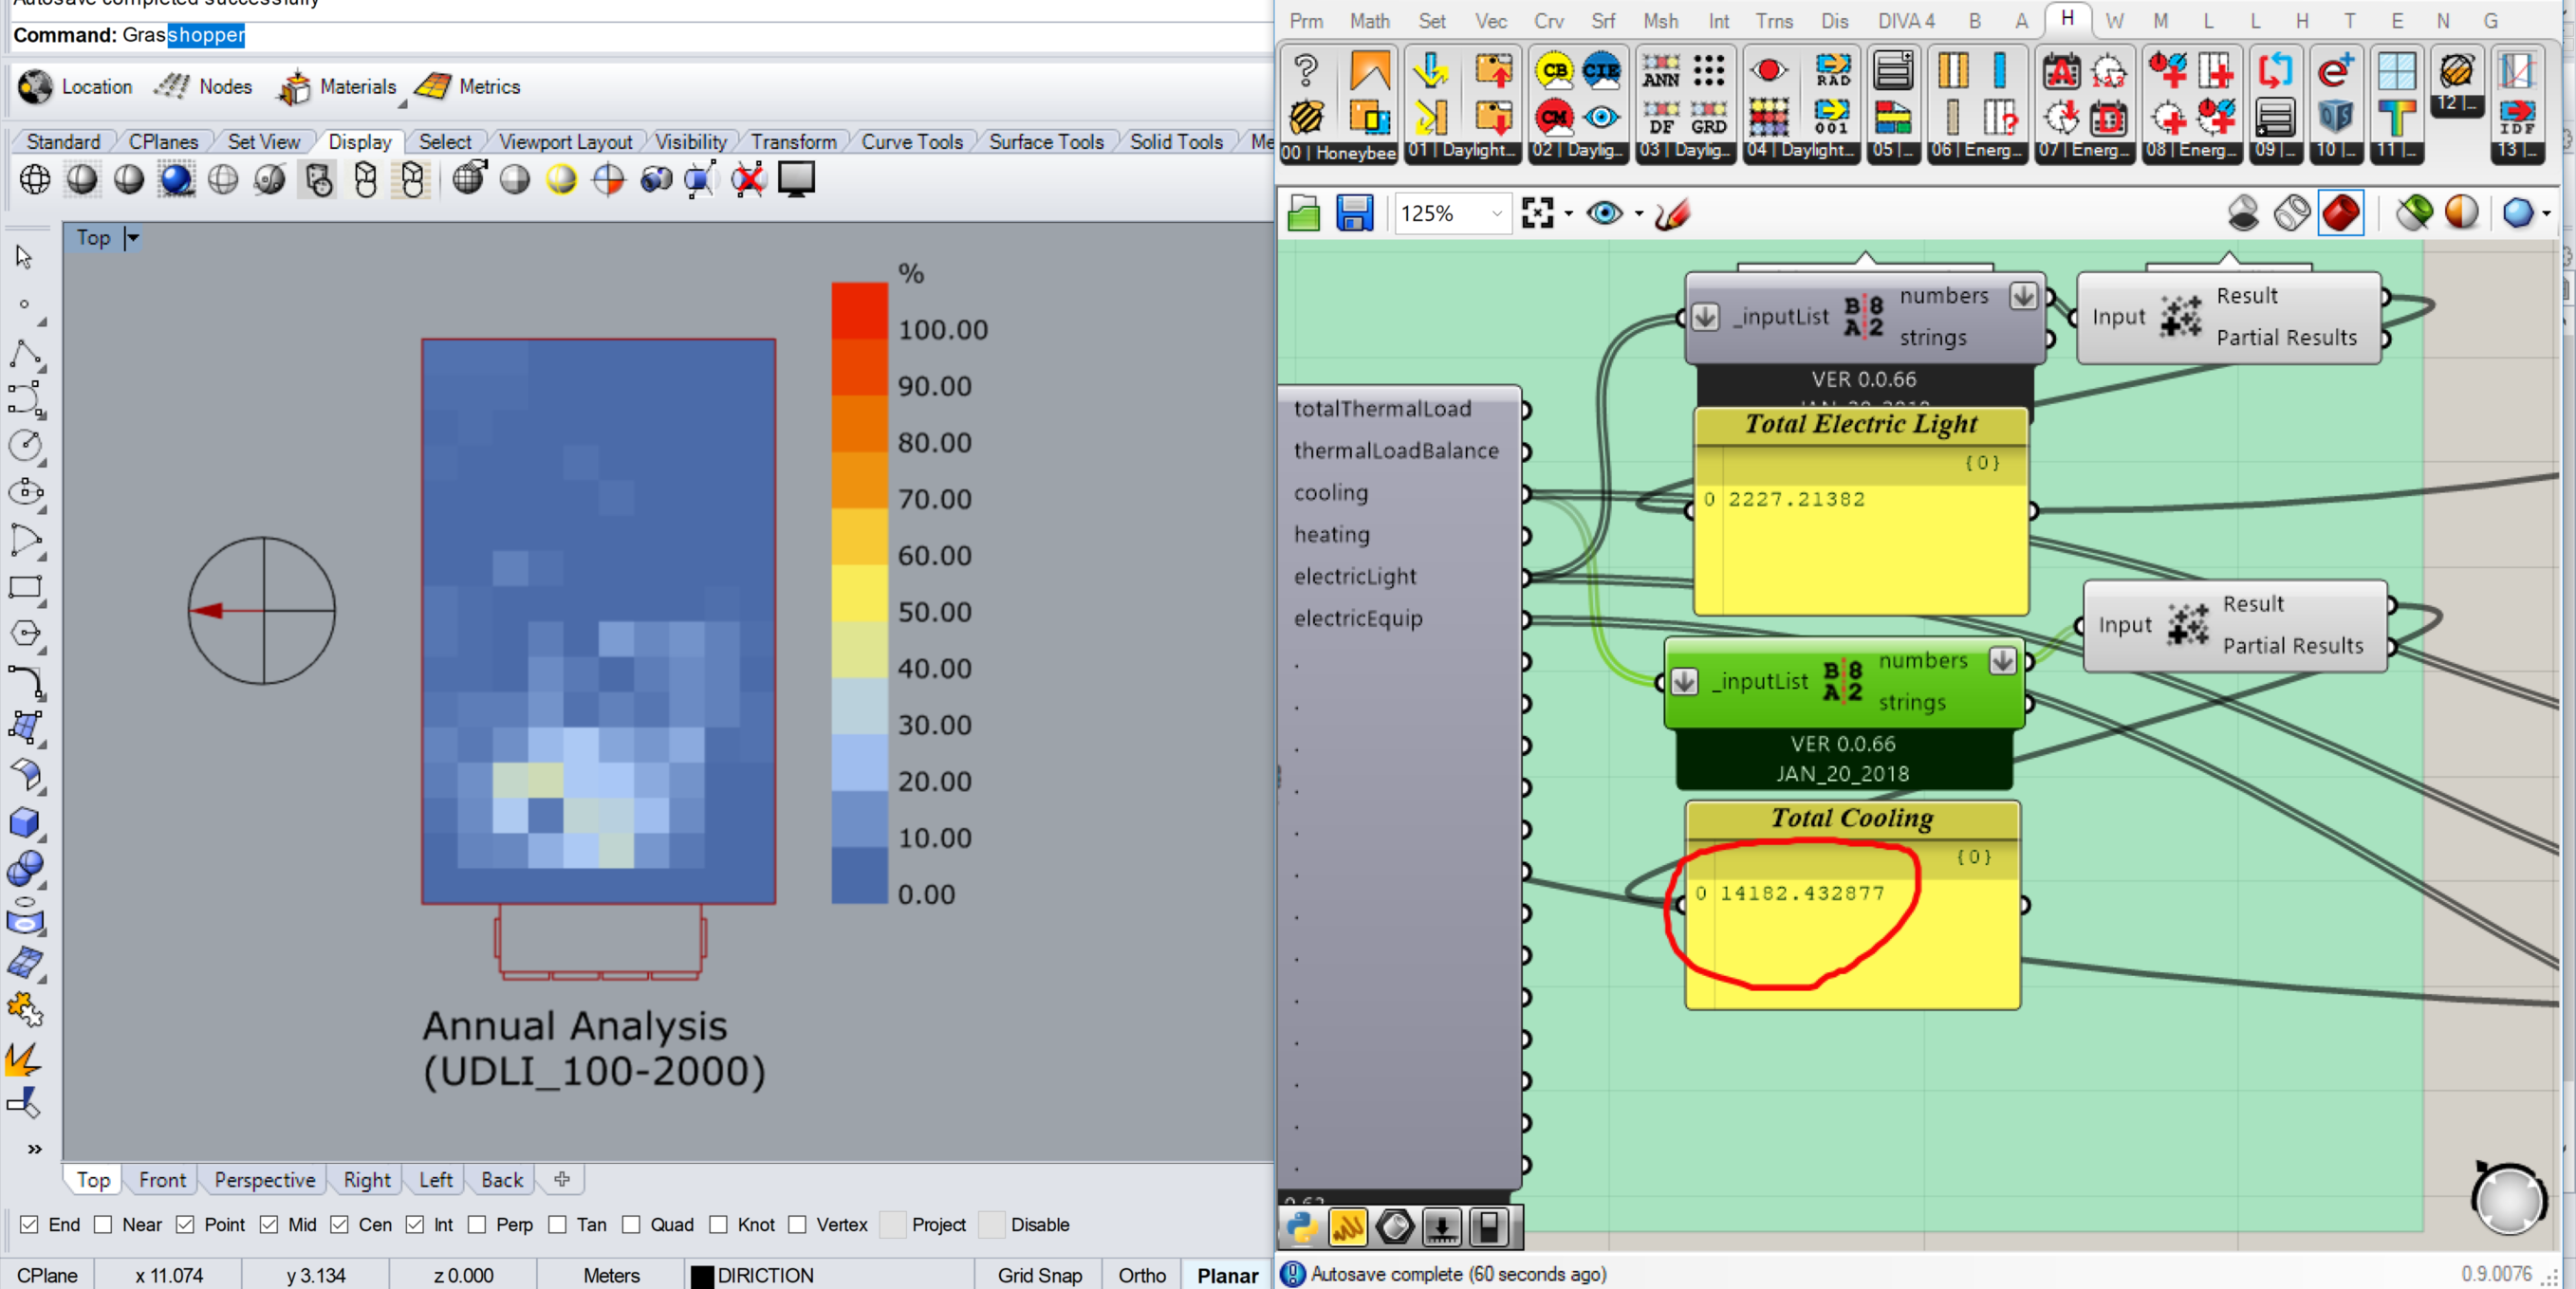
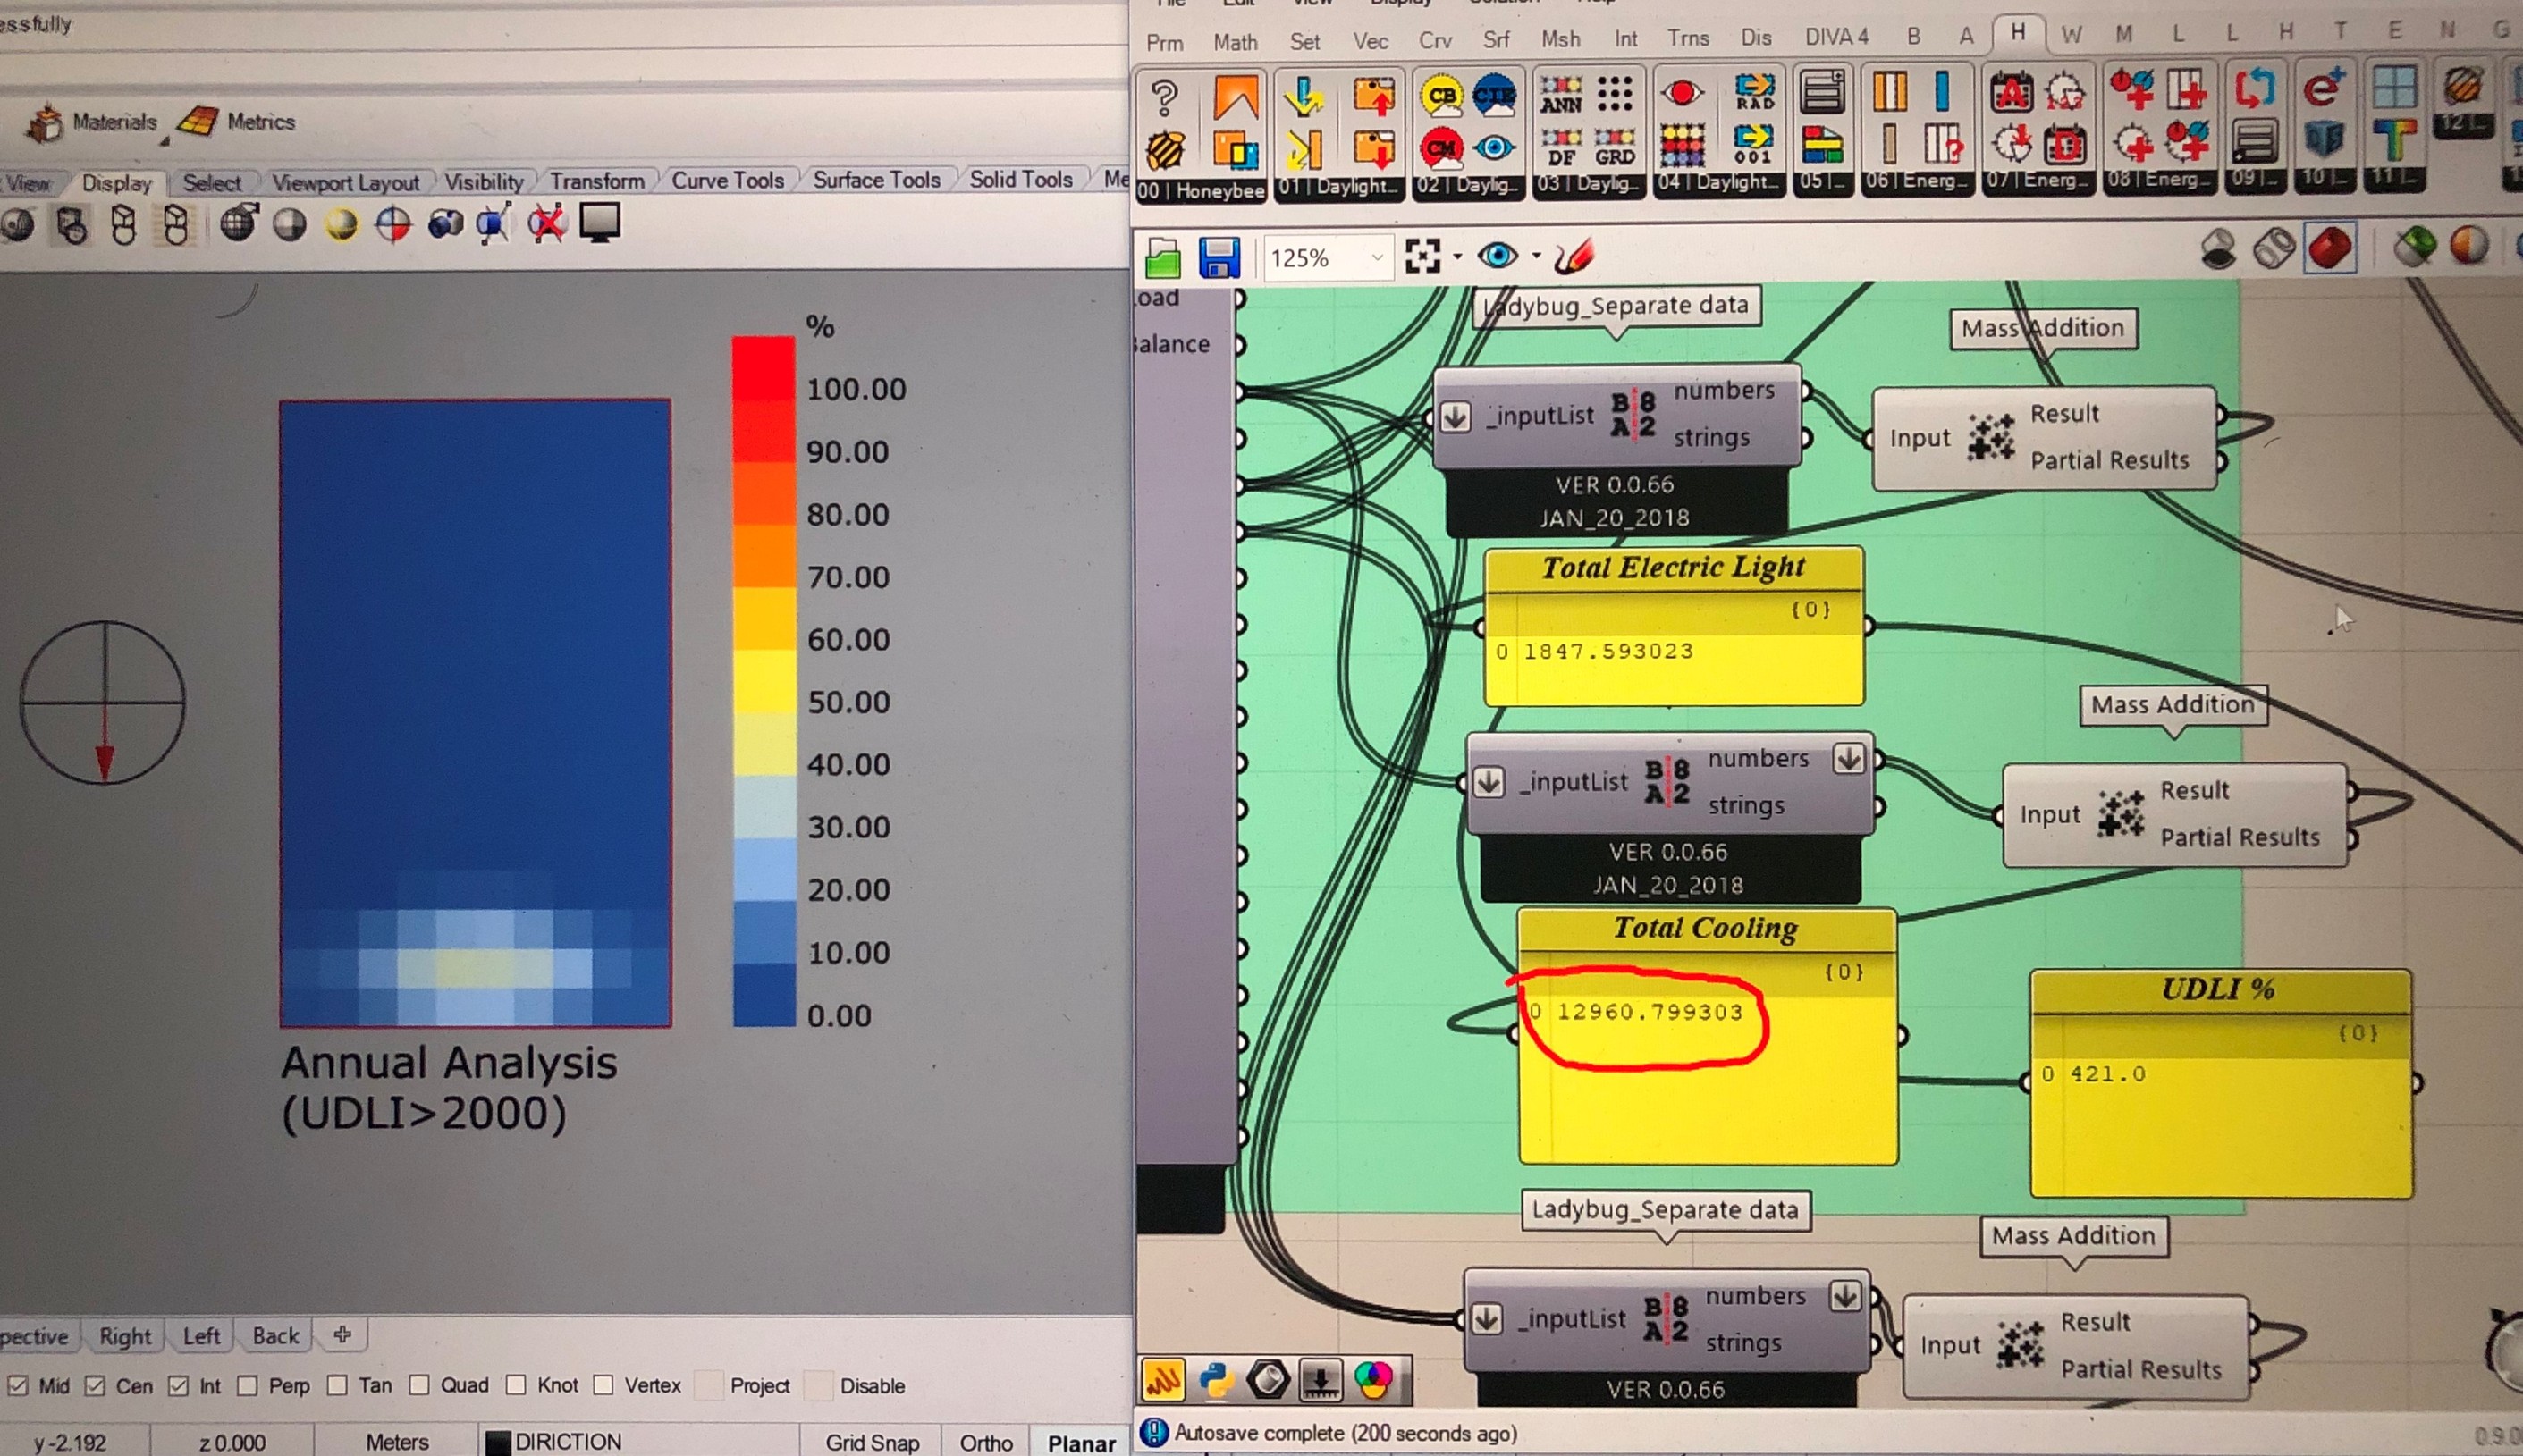
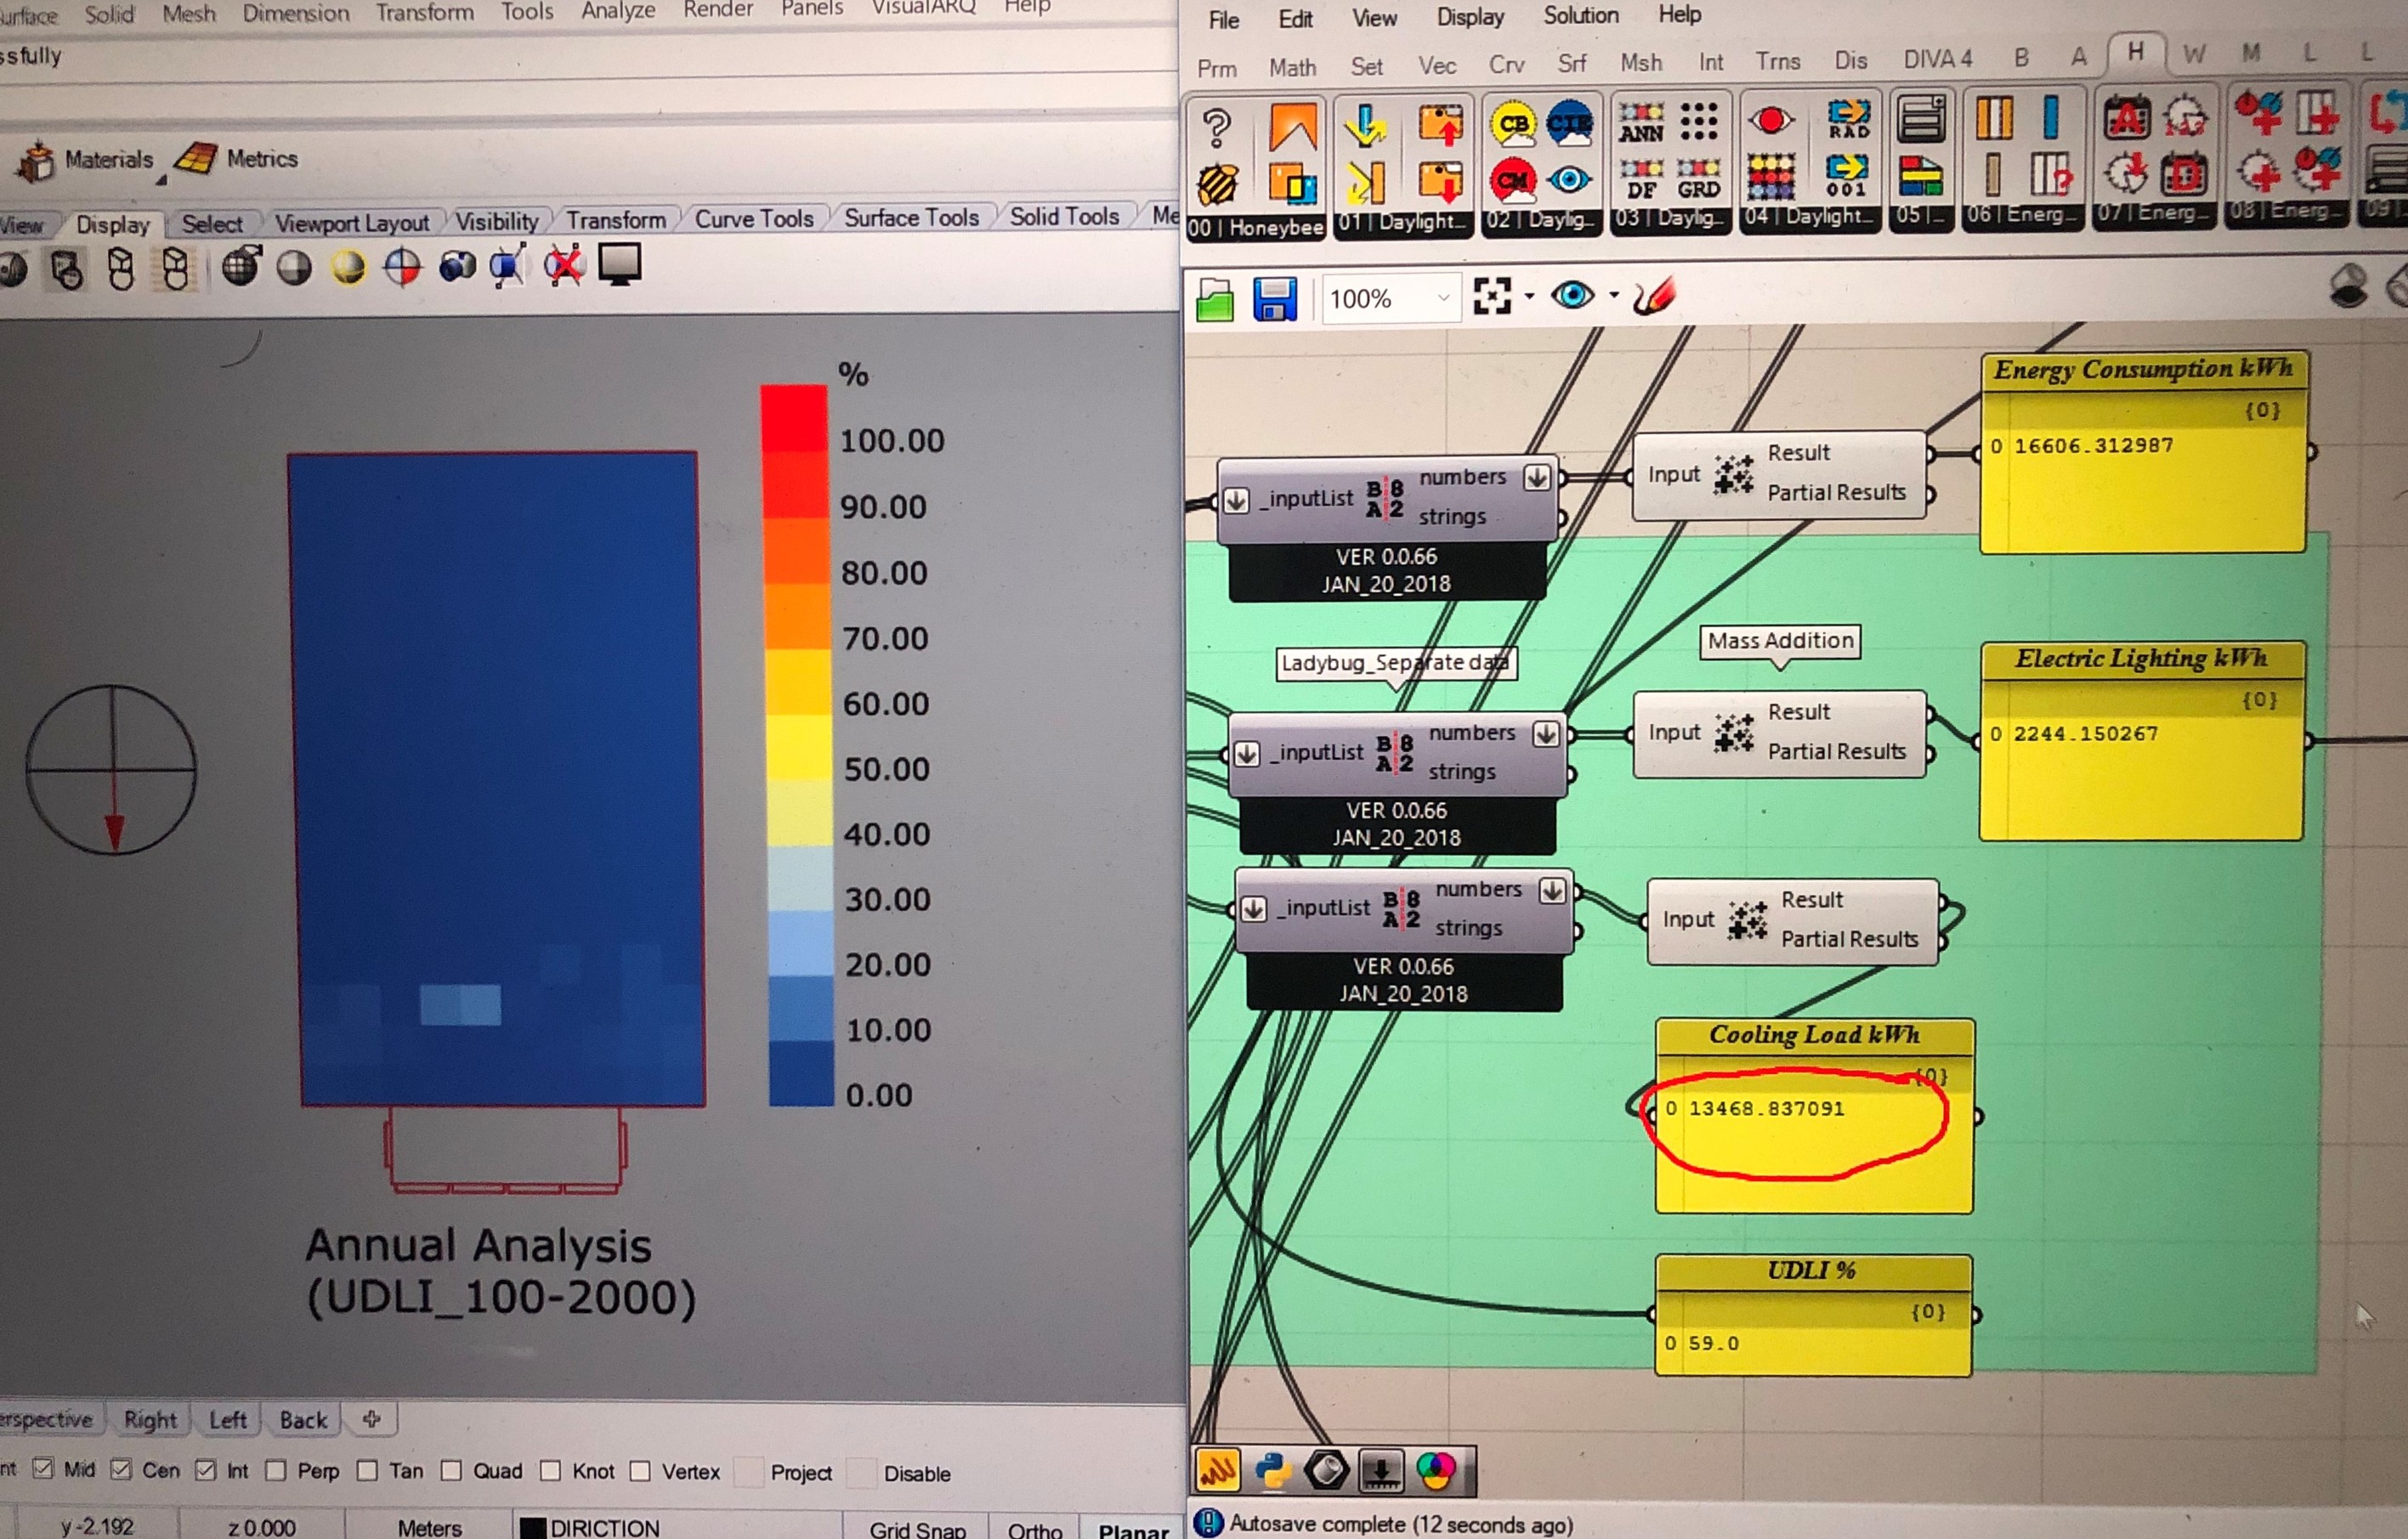
Logically, whenever it has much daylight comes from the sun, it increases the heat gain into a room, therefore it increases the cooling. However, what I got when I applied a shading device in a previous room, I got the opposite result, as you see in following photos!
From the results you show in the bottom image i can see that the cooling consumption is ~14000 and not 17303 as you wrote. If so, is is lower than the 16946 without shading device.
-A.
Hard to say without checking the file. But from the images i also see that the north direction change. The last ones show that the window is in the north facade. This can explain some things …
-A.