Hi Chris.
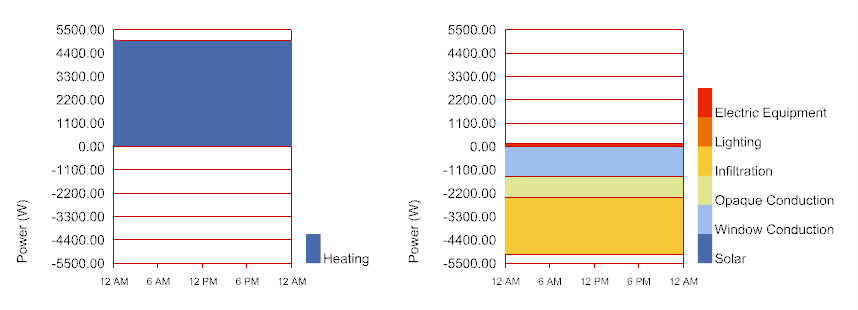
On my heating load chart, I can only see a few pixels of variation from “flat”. I changed weather files and it’s still “flat”. It seems odd because of course the temperature will change throughout the coldest day, so I would expect some variation, but maybe the chart is as expected?
Cooling load looks similar to your image above.
Hi @JimMarsh ,
I moved your question to a new topic since the other post your originally had this on was 6 years old and there have been a lot of updates since then, even though your question is general enough to be relevant then as it is now.
I know it seems conservative and unrealistic but engineers will typically assume no sun at all on heating design days. They will also assume a single constant low outdoor temperature. Obviously, this is not the best representation of the actual coldest day that the building will experience in reality but I imagine that engineers are just trying to cover themselves and maybe also “future proof” their work since factors other than the weather can influence the sun that a building receives (eg. new high rise buildings going up across the street). Admittedly, I don’t have a good reason for why engineers use a single constant low temperature for the heating design day instead of an hourly temperature profile but I imagine it really simplifies the calculations and, while trying to use a real profile of a cloudy day might result in some small savings of heating load, it’s probably usually not enough to justify the more complex calculation. But all of that explains why your heating design day profile is flat.
Granted, cooling design days are very different, which use both a sunny sky and a sinusoidal temperature profile over the day (peaking in afternoon). I know the difference between using these changing conditions compared to a constant sunny sky and hot temperature is really big so this kinda “forces” engineers to model cooling design days this way. So that’s why you’ll typically see more interesting cooling design day studies than heating design days.
Have never heard this. Okay then, I’m doing it right. Thanks for the explanation!
Hi, chris,
Is there any way to add/count the solar gain for the peak heating load balance (HB Peak Loads: heat_bal)? As you mentioned it is not the best representation of the actual coldest day in reality. I am trying to see the glazing ratio impact and how window solar gain can help it in winter.
Thanks,
Julie
