Kia ora tatou
I am trying to update an old diagram constructed with the legacy version of LBT. Essentially, I was very naive about Rhino display at the time, so I wish to update this diagram.
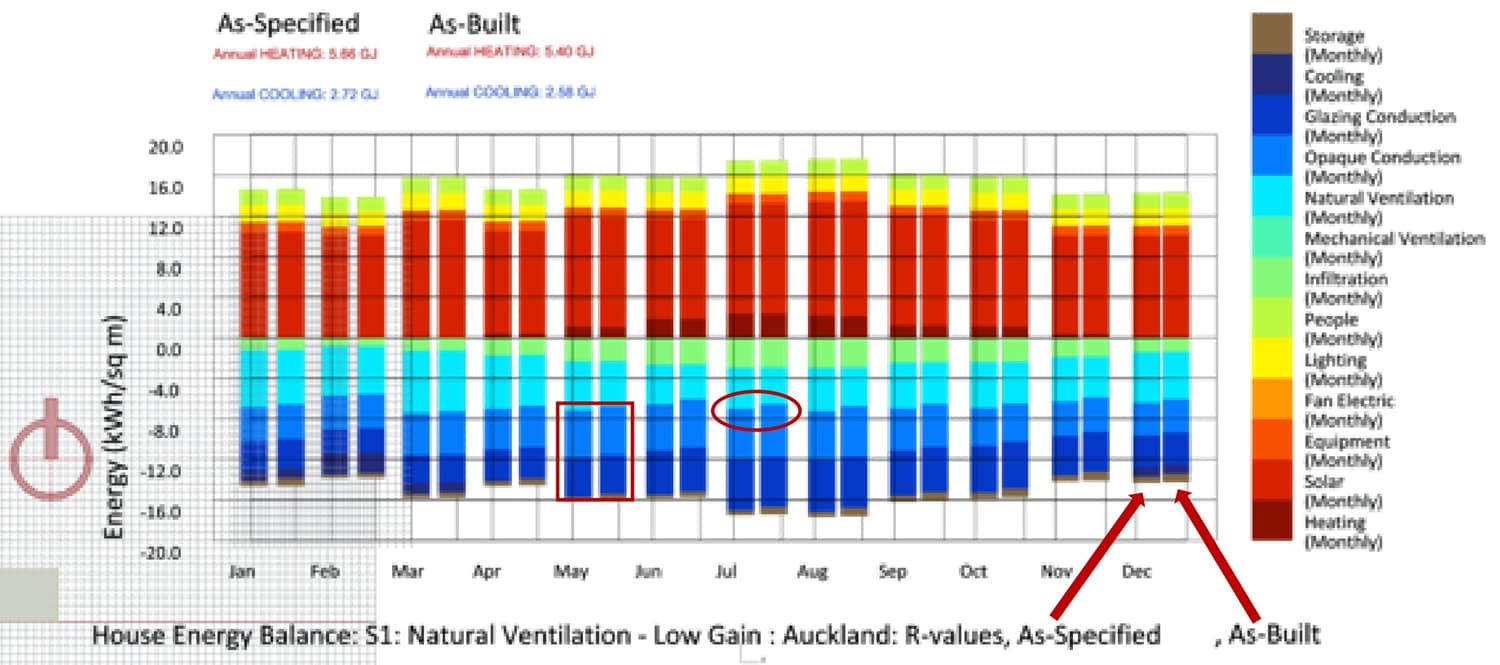
As you can see, it is messy and low resolution, partly because i have overlaid two simple Load balance graphs to allow easier comparison of the Opaque Conduction between the two designs.
What I am trying to do is load the results from the sql files produced 6 years ago and plot them using the new Load Balance and display options (and my own - slightly improved - knowledge of Rhino display options ).
Everything works fine, except there is no longer ANY “Opaque Conduction” information displayed. There is clearly a significant amount in the original sql file that I had saved and am mining (see the circle and square box highlights in the image).
As far as I can see, this is how the connections should be made. the face energy flows link should amalgamate all face energy flows (Opaque and Window) break them up and display them appropriately.
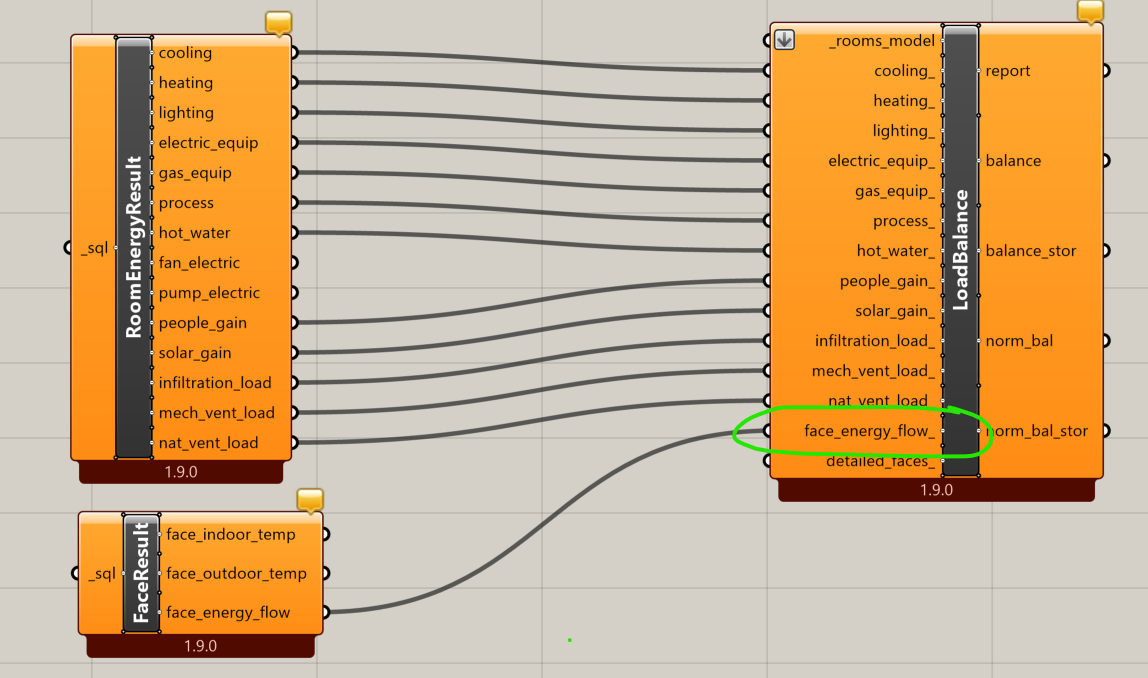
There are certainly multiple data collections being output from the component. But only the Window Heat loss via conduction is calculated.
I am wondering has there been a change in the labels of the Opaque Conduction Heat loss in EnergyPlus that makes this process unreliable?
Any and all thoughts welcomed.