Hi,
I am trying to figure out what is behind the Window Conduction when plotting HB Peak Loads.
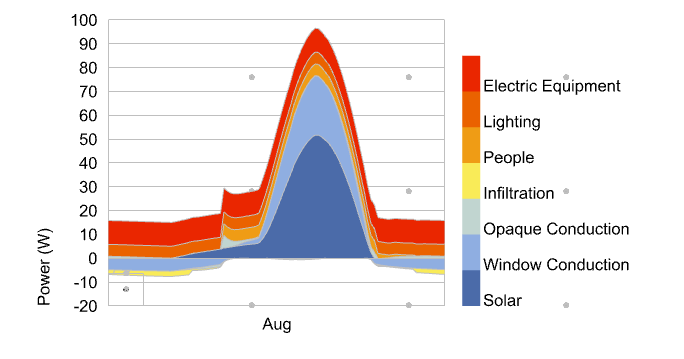
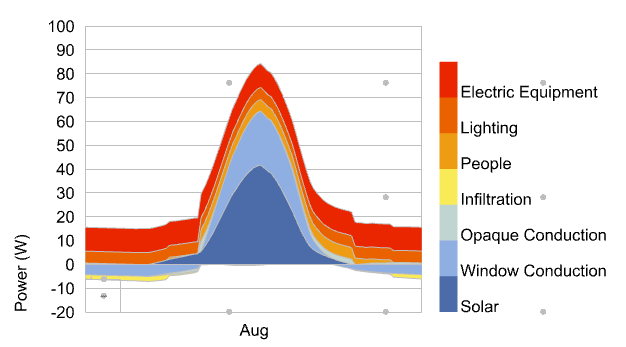
Looking at a shoebox with given glazing ratio, I get presented with this peak load chart which I am not sure I fully understand.
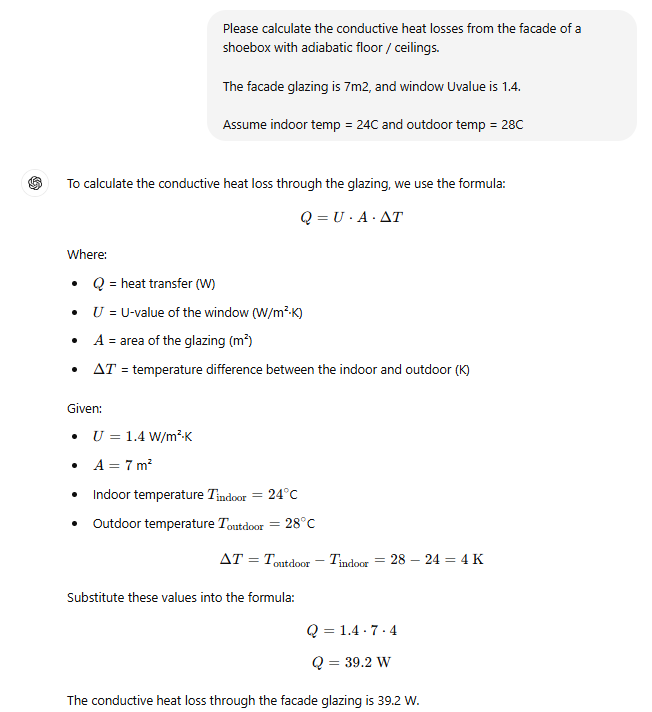
One would think that, were this the result of conduction heat gains (or losses), this would reduce with an improvement in Uvalues. However, changing Uvalues has a negligible impact on this.
Given I am testing this for London, UK, where temperature difference between indoor and outdoor temps would be minor for the Uvalues to make a real difference, I was tempted to assume this Window Conduction gain would indicate a ‘secondary’ solar gain gain, i.e. the absorbed solar radiation that would be re-emitted into the indoor thermal zone.
I tested a south and a south-west orientations, and in both cases the amount of Window Conduction appears excessive, when compared to Solar, which would contradict my hypothesis of this being secondary (re-emitted) solar heat gains.
Any idea of what this may be? What eplus variables is this plotting?


