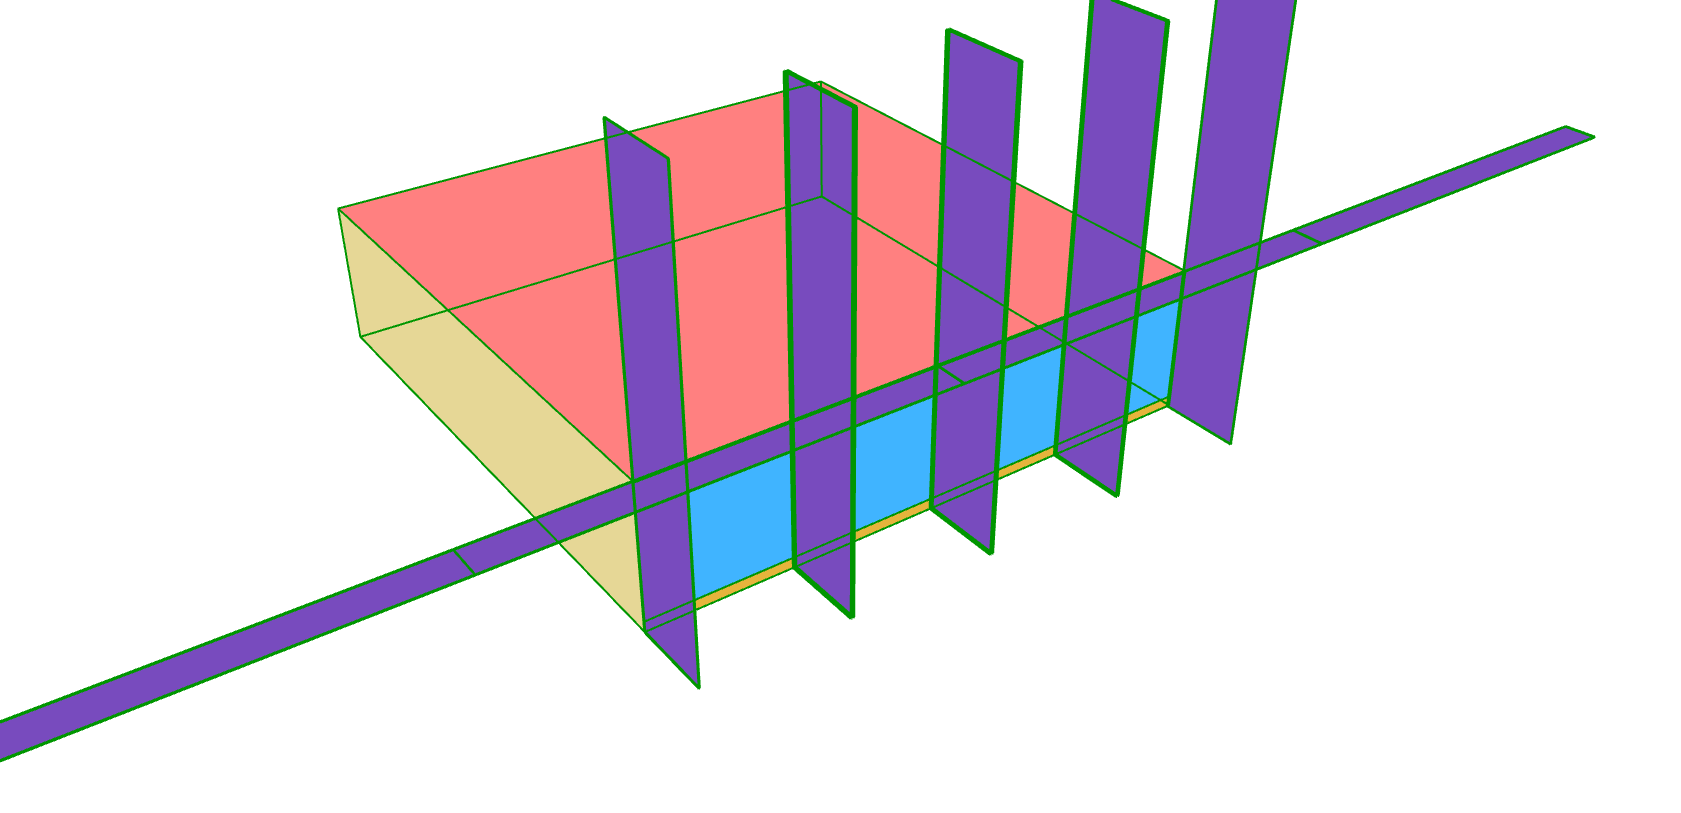
The box is 12*12m, 3m high, 90% WWR. Window shgc = 0.29, U=1.4 W/m2K. The wall U-value = 0.55 W/m2K. The gains and schedules are set up to reflect office usage (custom set up). All surfaces are adiabatic excluding the glazed facade. The glazed facade faces SE (morning sun).
I’ve turned off all ventilation exc infiltration and am using an IdealAir system with no economiser, no demand control vent, and no limit to the heating and cooling. Heat and cool temps are 30C and 15C.
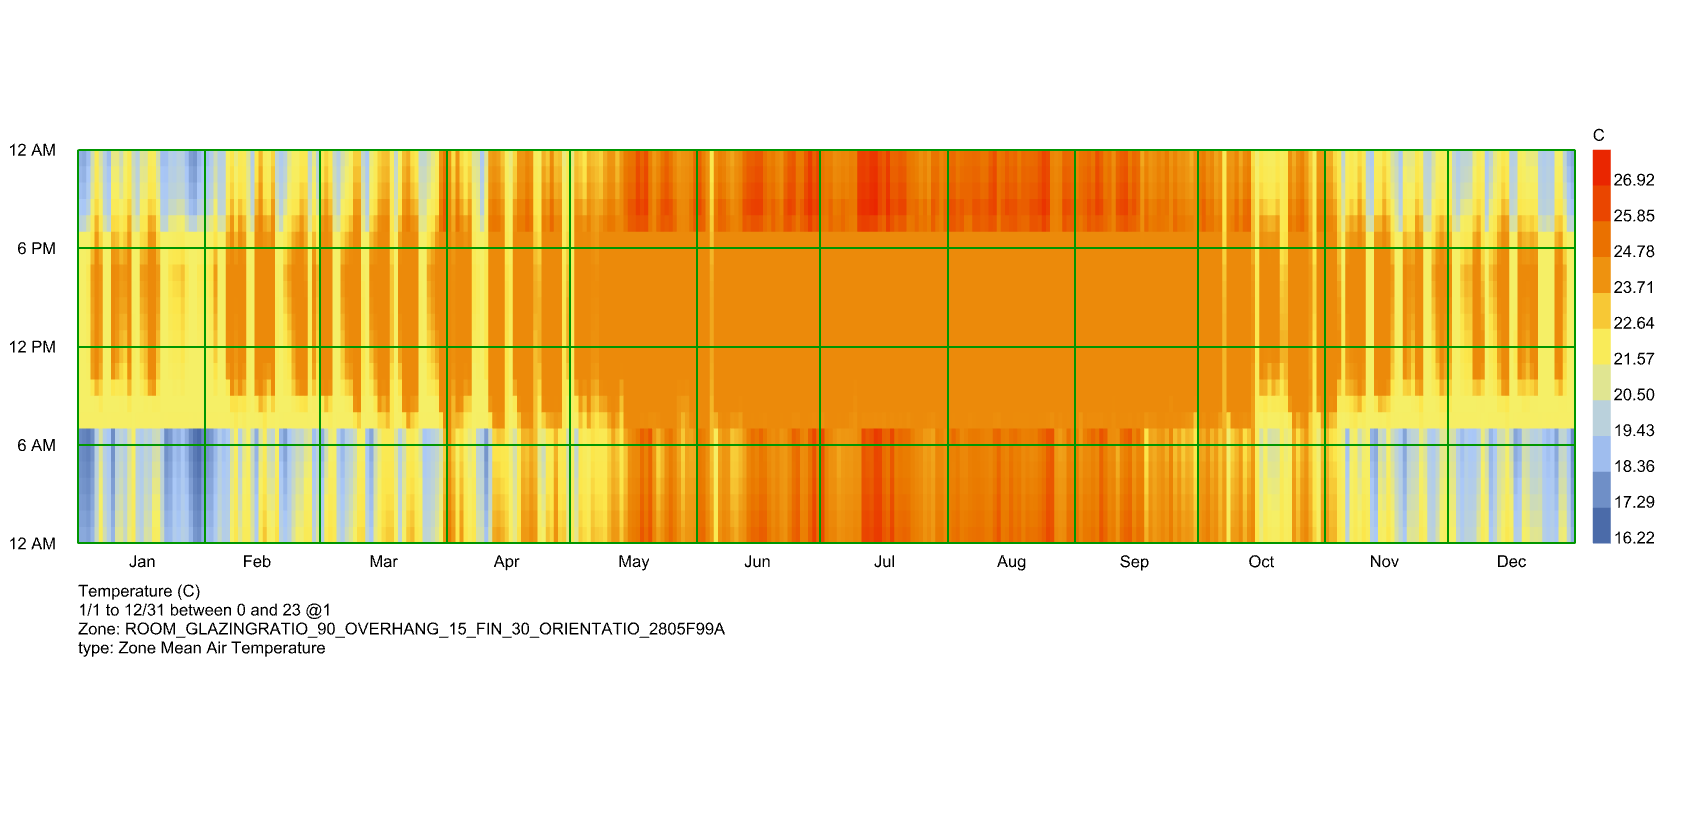
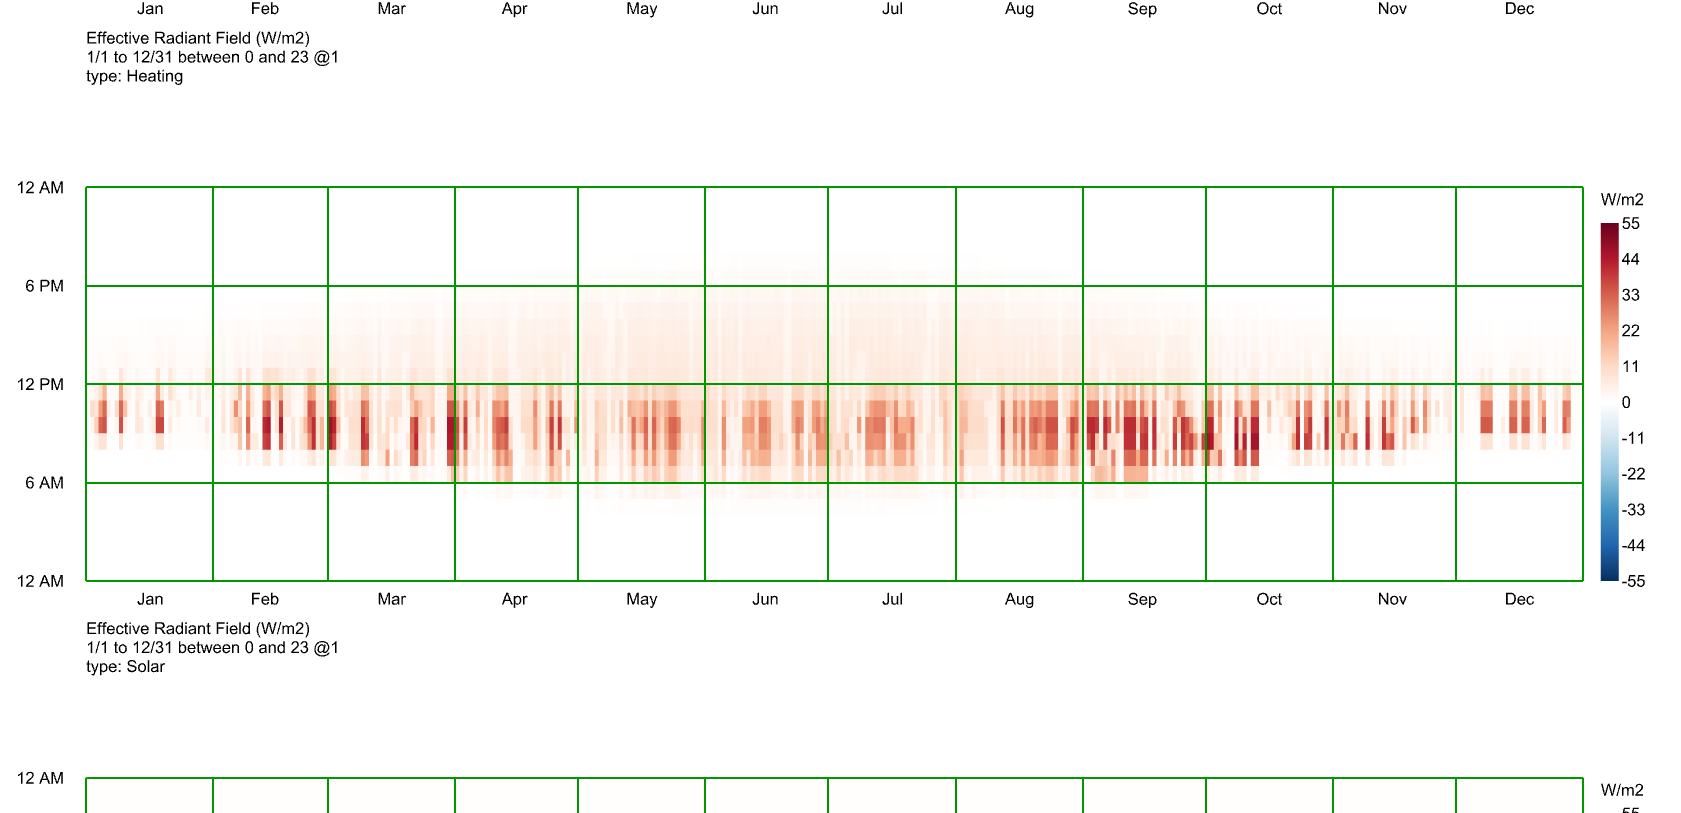
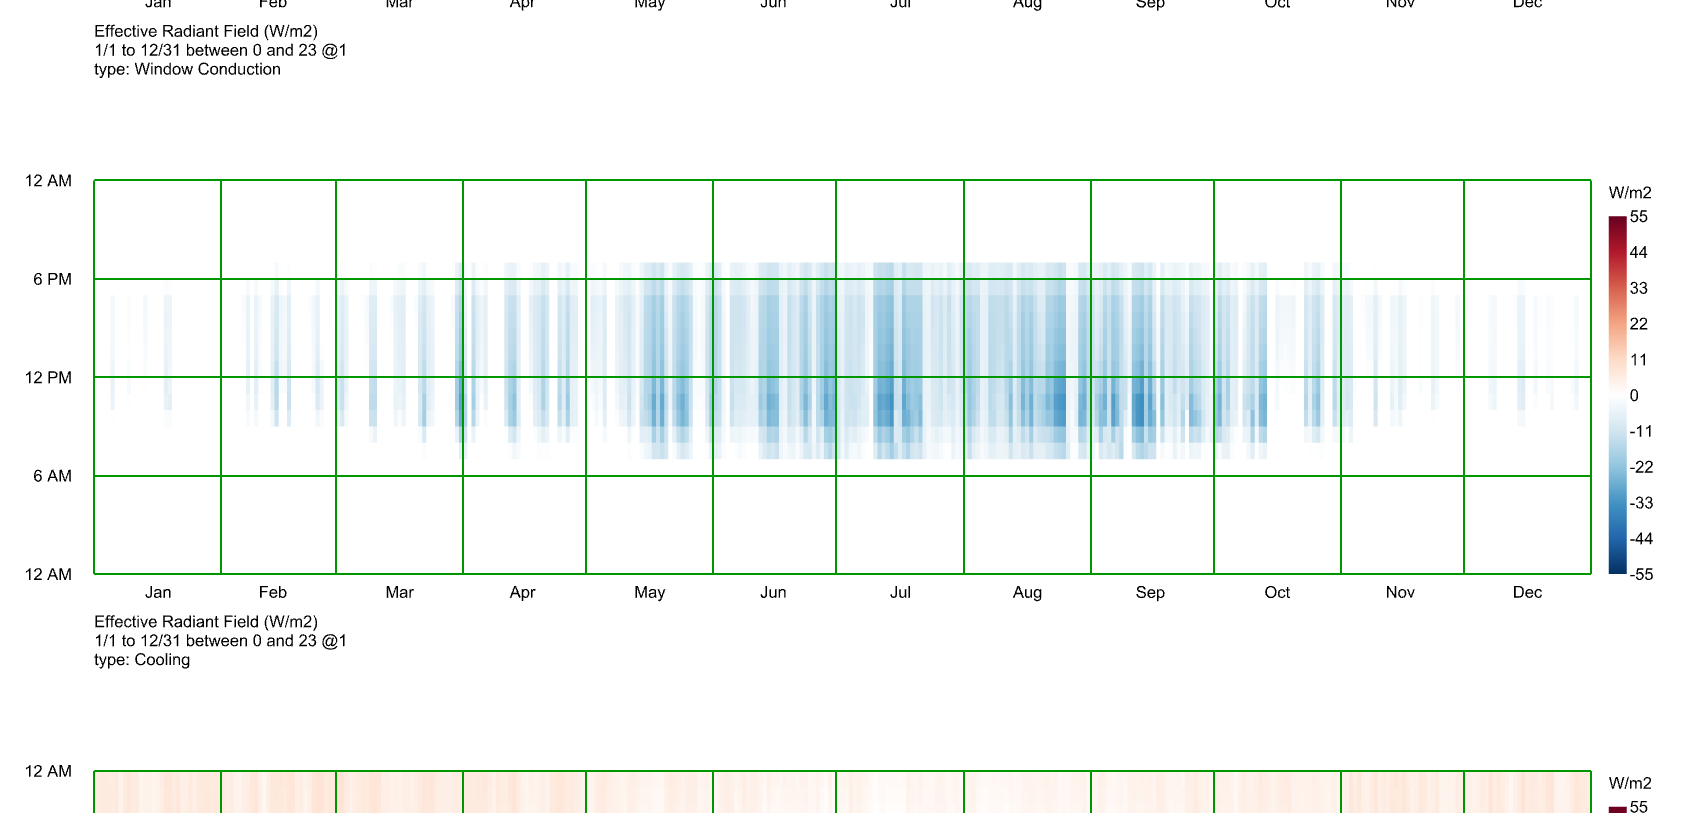
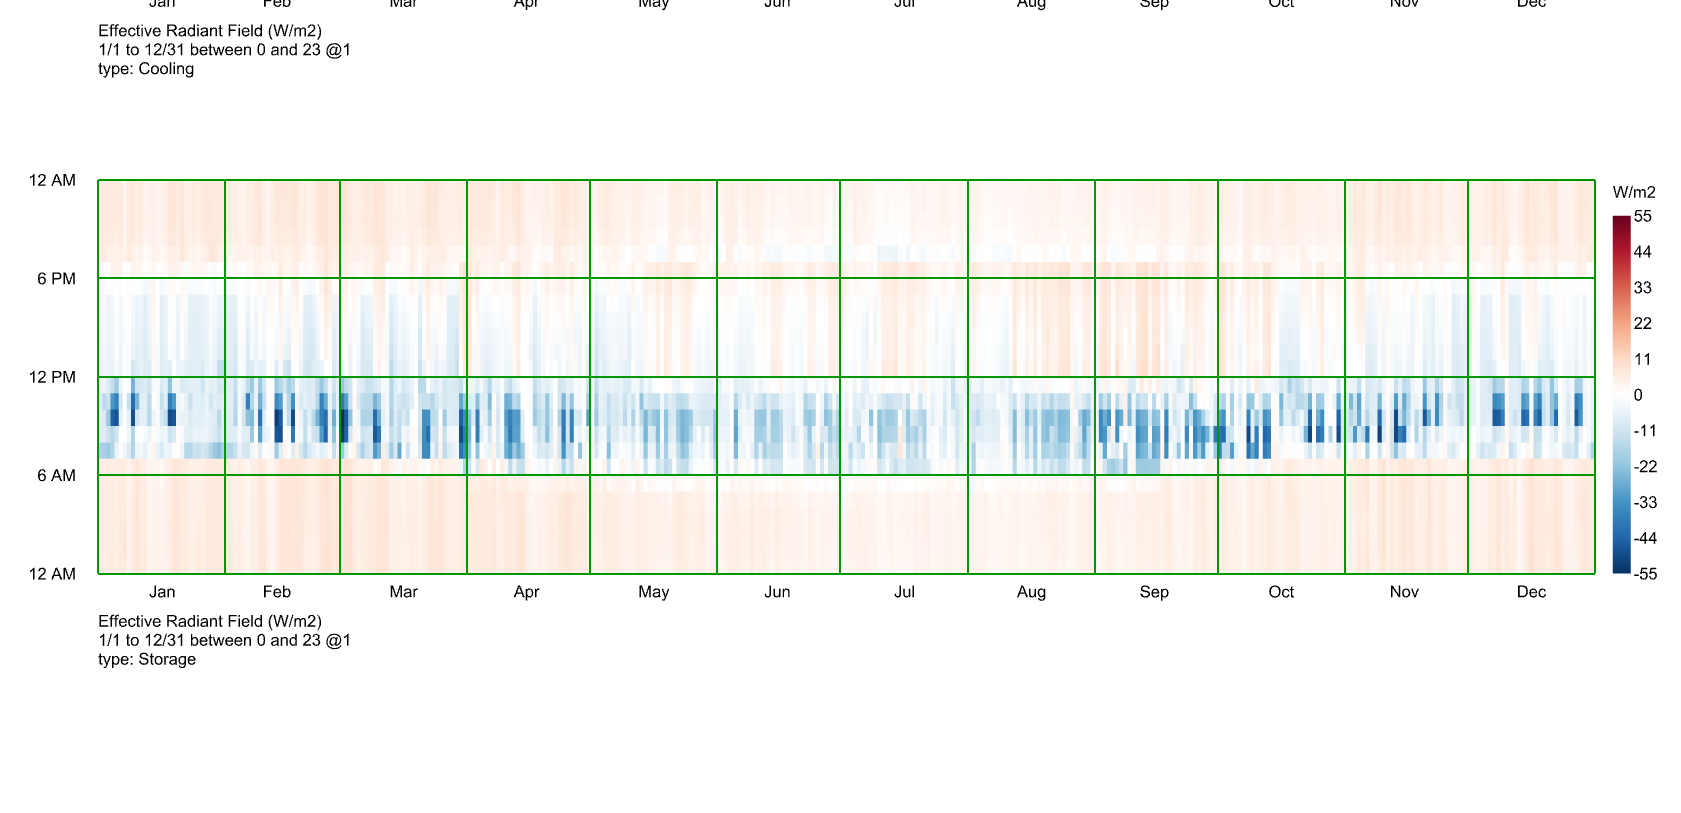
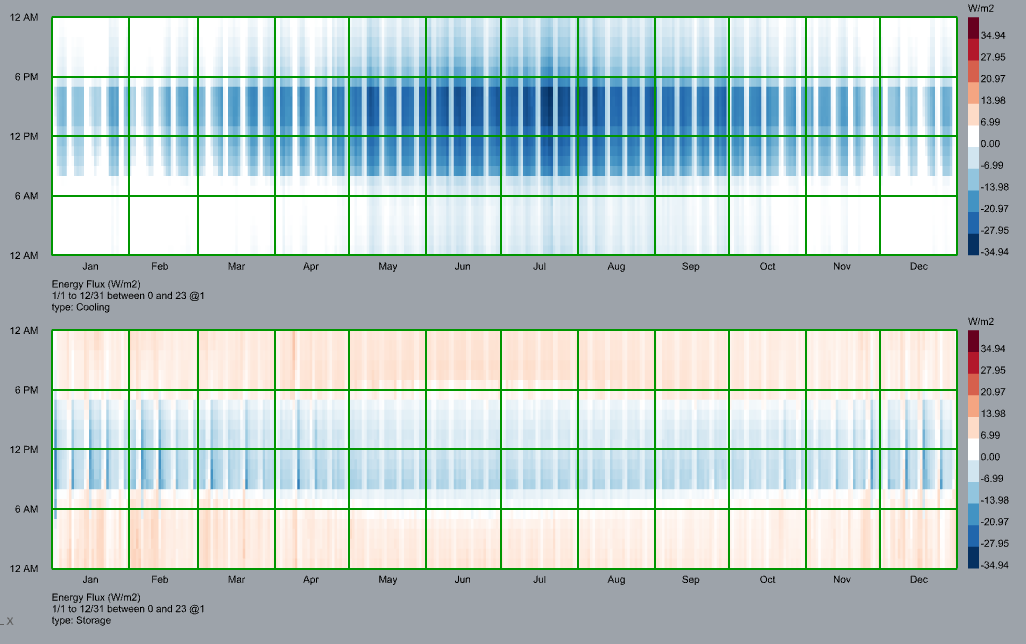
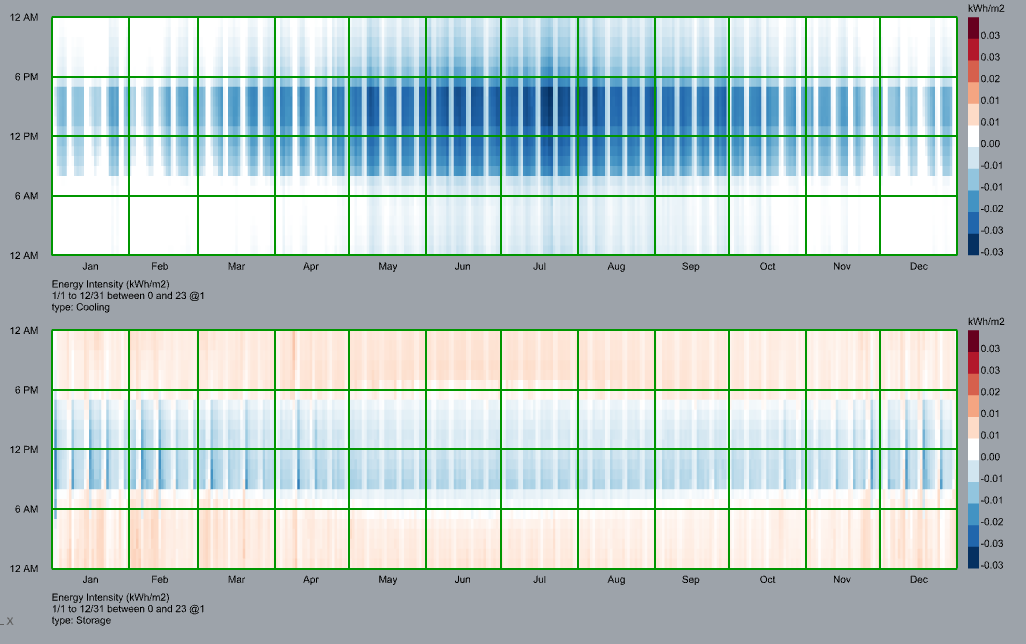
I’ve posted some relevant data below. My interpretation is that the solar gain coincides with storage loss which I’m struggling to understand. Is this a case of the solar entering the room, causing a gain, but then being absorbed by the room’s surfaces (increasing their temperature) to then immediately act as a loss?
Your conclusions seem reasonable to me. There’s honestly not that much sophistication to the “storage” term in Honeybee load balances. It’s just computed as the remainder of all the other terms to balance things out. When you have properly accounted for all other terms of the load balance, then the storage term will be just the energy that is stored in the mass of the building. This includes the energy stored in the building surfaces (especially things like interior concrete floors) as well as energy stored in the mass of the Room air volume.
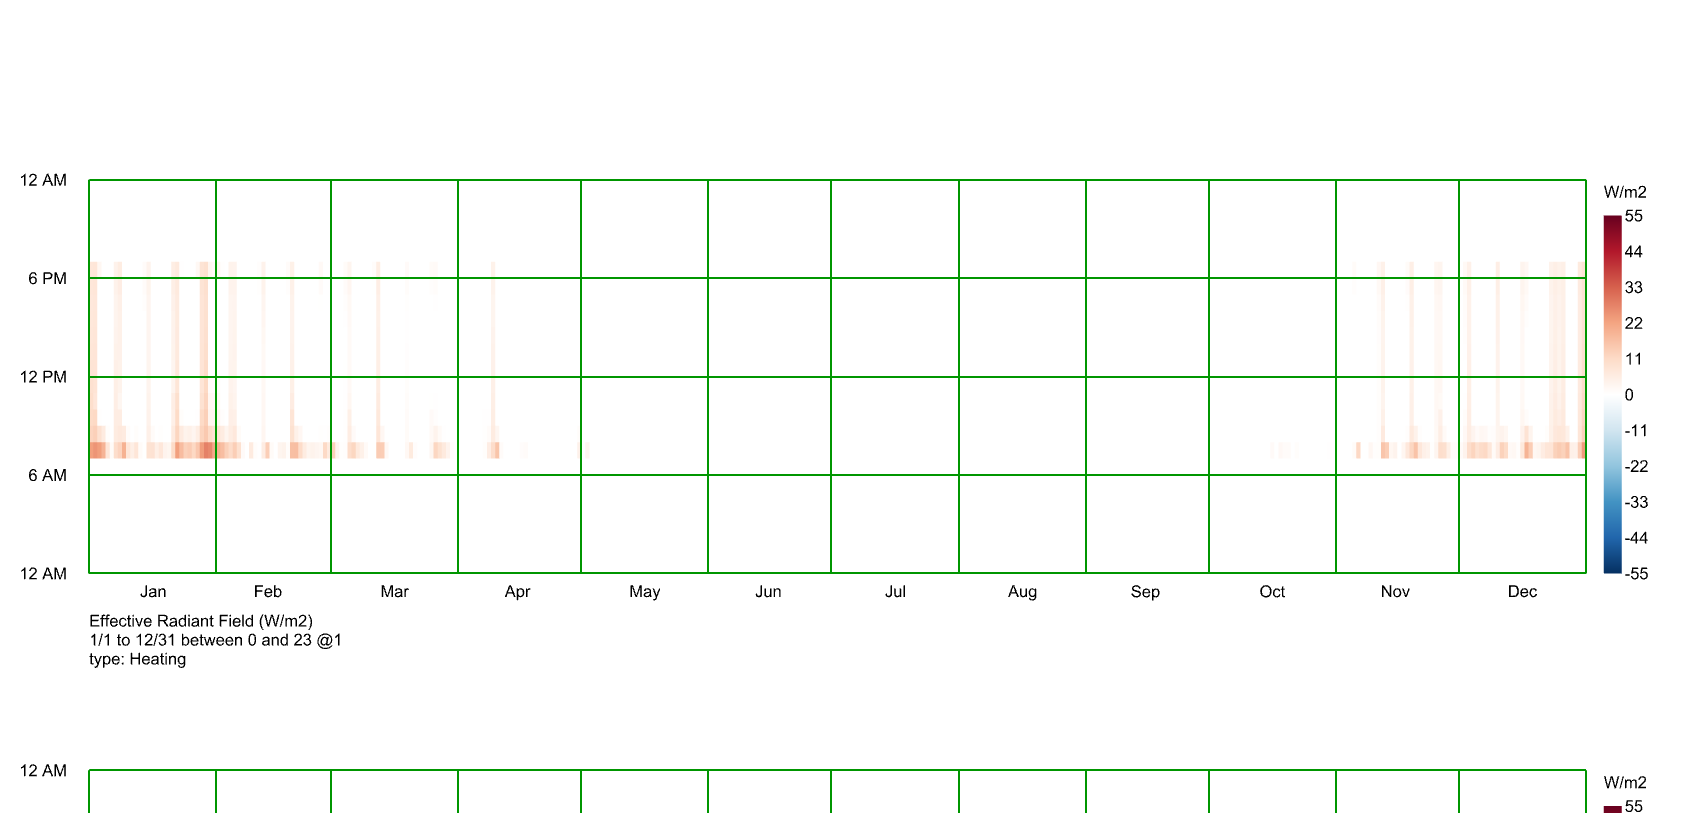
If your space is conditioned and the heating/cooling setpoints are not too far apart, the storage term will usually be close to zero when you look at it over a long time period like a month. However, it can change a lot on an hour-by-hour basis within a given day. What you are seeing in your last plot there is probably the concrete floor soaking up a lot of the heat as the sun beats down upon it. Then, it looks like it releases a lot of this heat at night as it gradually cools down.
Hi @charlie.brooker , I am looking at the monthly accumulated load balance for a building, considering only solar gains, internal gains, infiltration, conduction losses via fabric and windows, as well as cooling/heating loads. How can I acquire these load results in W/m2 (without any hourly considerations), similar to the graphs you provided? Really appreciate your help! - Julie
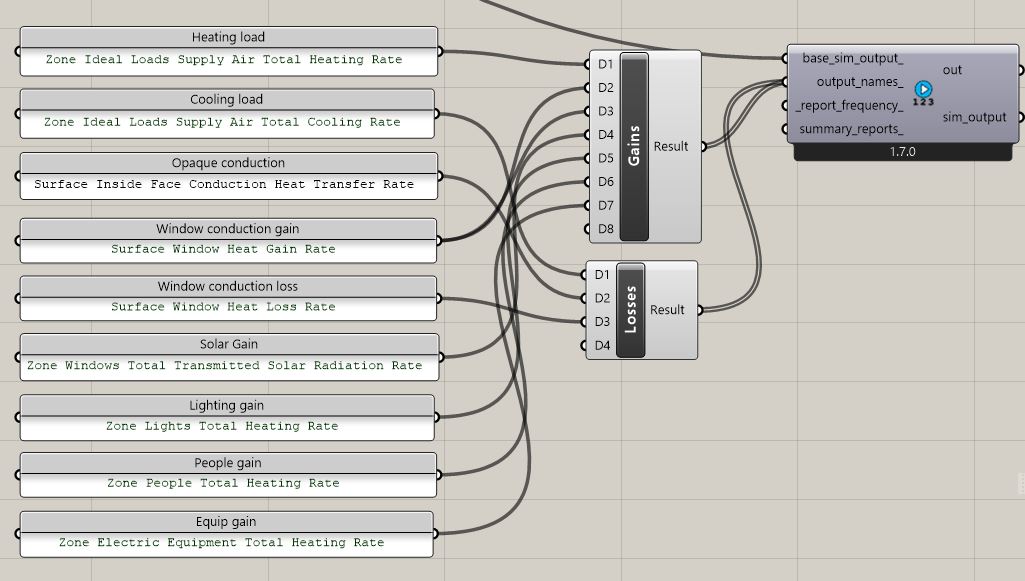
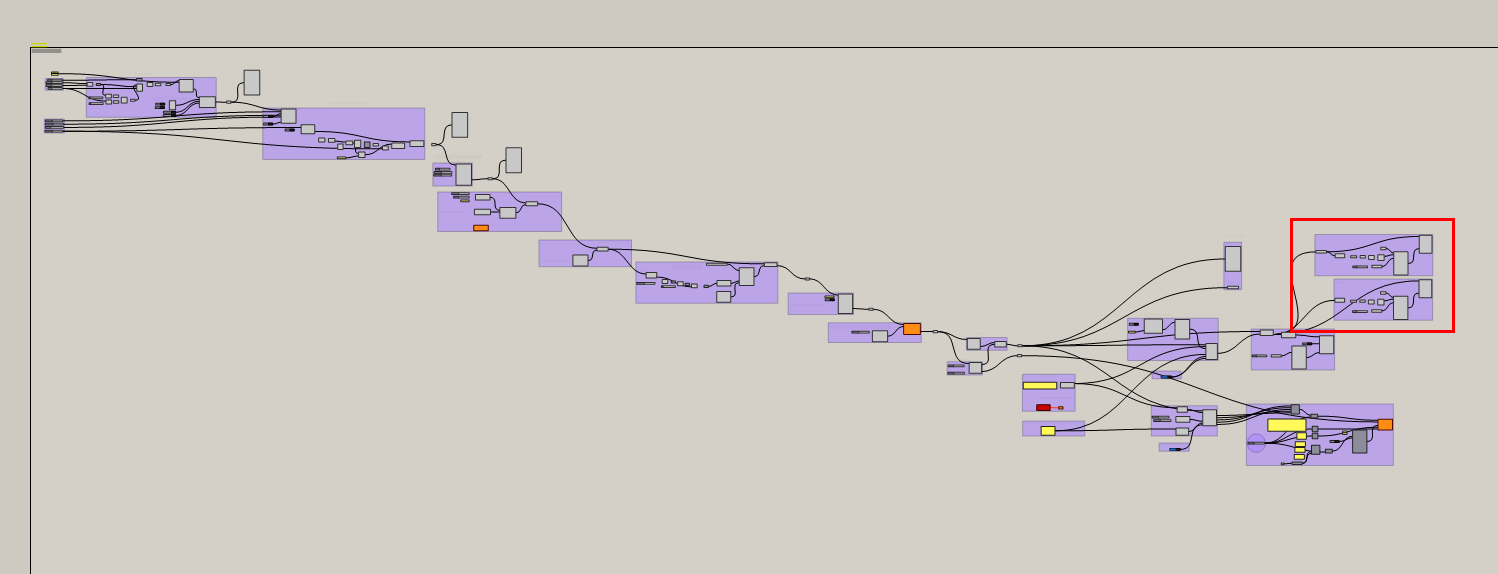
@charlie.brooker I am looking at heating/cooling load and breakdown gains/losses results (in W or W/m2) instead of energy intensity (kWh). I guess I should use HB Custom Simulation Output component (shown below)? Could you have a look if I have selected the right custom outputs? - sorry I am not really familiar with energy plus outputs
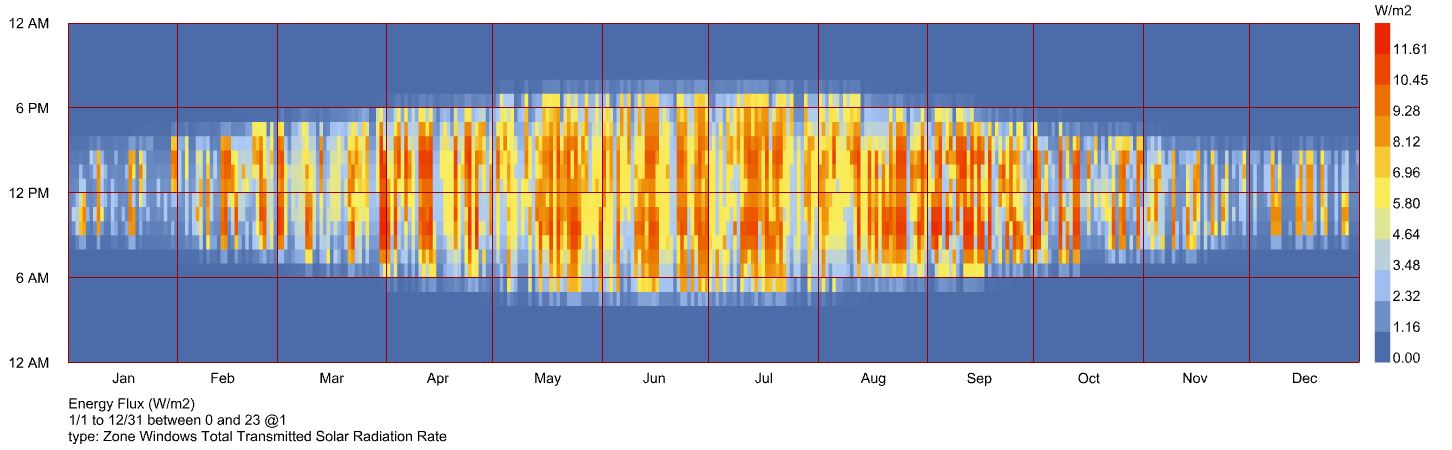
When I plot it on an hourly chart, it shows in Energy Flux rather than Effective Radiant Filed (yours). What is the different between these? How did you get yours?