I’ve come across something in LBT v1.2 that perhaps has a simple explanation but I cannot seem to figure it out. For context, we’re looking at upgrading an existing school, so are testing various options as upgrades to the “baseline” model that we’ve calibrated.
I have run 3 simulations with only the following being changed:
Baseline: U6.5, SHGC6.5
Test 1: U4.5, SHGC0.6
Test 2: U3.5, SHGC0.55
Test 3: U2.5, SHGC0.5
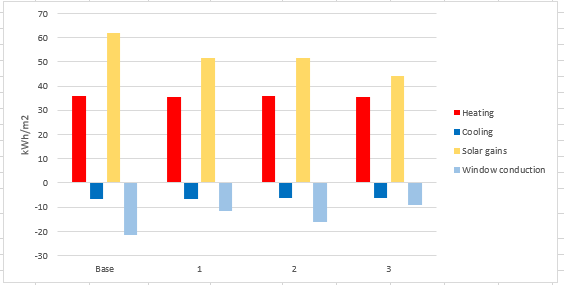
I would expect that with each case, the window losses to decrease, the solar gains to decrease and the heating demand to decrease also.
Test 1 and test 3 demonstrate these expected results, however test 2 doesn’t seem to follow this pattern at all. I put together a quick chart, showing the load balance results for these areas of interest:
I should also note that I’m using the simple window material component with the u-factor, shgc and t_vis inputs. I’m not sure if this would have anything to do with it.
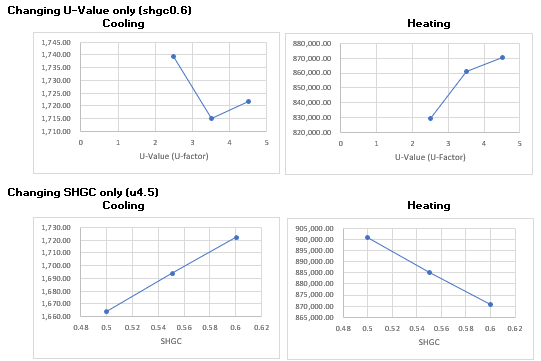
I also tried testing the changes in U-Value and SHGC separately, and the SHGC has a linear effect on cooling and heating, whereas the U-value does not.
I am completely lost so any input would be wonderful!!
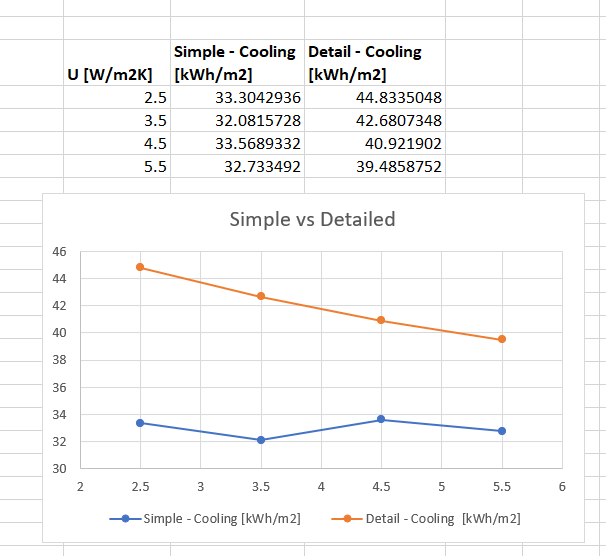
I think this is due to the crude nature of the simple window material component, and the way EnergyPlus (EP) attempts to disaggregate the U-value and SHGC into detailed material parameters for simulation. So even when you think you’re varying one parameter (i.e. U-value), you’re actually also varying parameters like solar transmittance since EP will use the former to calculate the latter. This is a reasonable assumption on EP’s part since those two values are physically related, but can be confusing since we (incorrectly) expect something like U-value to change one material parameter, and thus impact cooling load linearly.
Here’s a comparison between the cooling loads of a simple window model (which is converted by EP into a single-layer detailed window) and a single-pane detailed window model, for the same U-value increments you’re studying. You can see the same non-linearity occuring in the simple model but not in the detailed model:
That’s interesting - so EP will break up my “simple” window into all of the different parts that make up the detailed window by making assumptions?
I’ll definitely try recreating detailed windows and see what happens. However would it then be pretty vital that I know exactly what all of these layers should be, otherwise I could just be recreating the same issue?
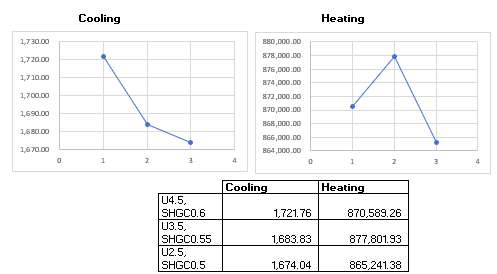
I just plotted both my heating and cooling results when I change both U-value and SHGC (still simple window construction), and am seeing similar results, so I assume this could be affecting the heating as well?
@SaeranVasanthakumar , that is quite an insight/learning that I couldn’t catch. Thanks. @JoGM , I am sure similar trends will also be seen in cooling and heating loads if simple window construction is used.
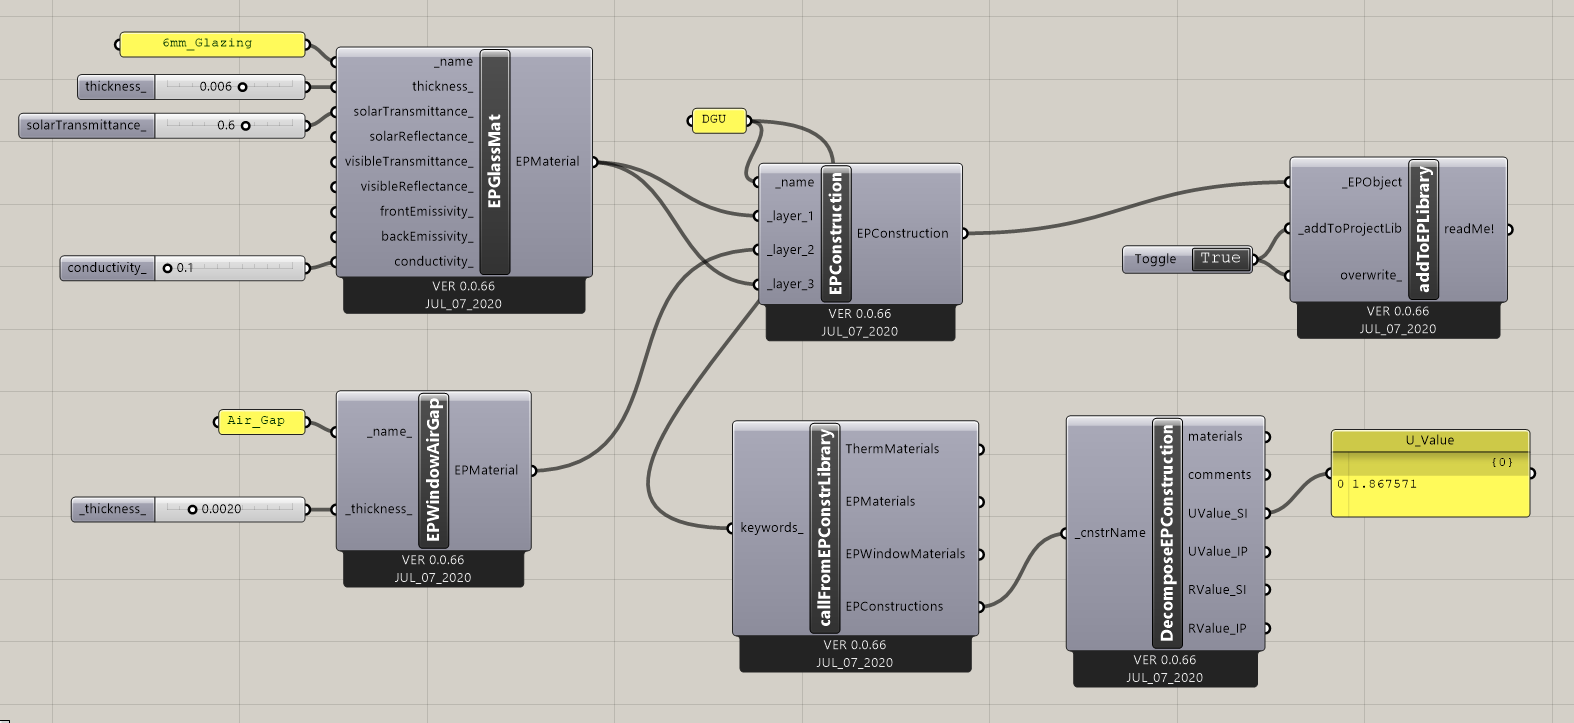
Kindly refer to the sample on detail window construction.