Hi.
By using e.g. mathlab, one are able to import results from a daylight factor calculation (grid points and results for the given grid points) and further investigate the results. One interesting thing to do, is to find the area of a floor plan, that meets the given requirement. E.g. how many desks can be placed in the depth of a room, and still meeting the requirement of e.g. at least 2.0 % i average daylight factor.
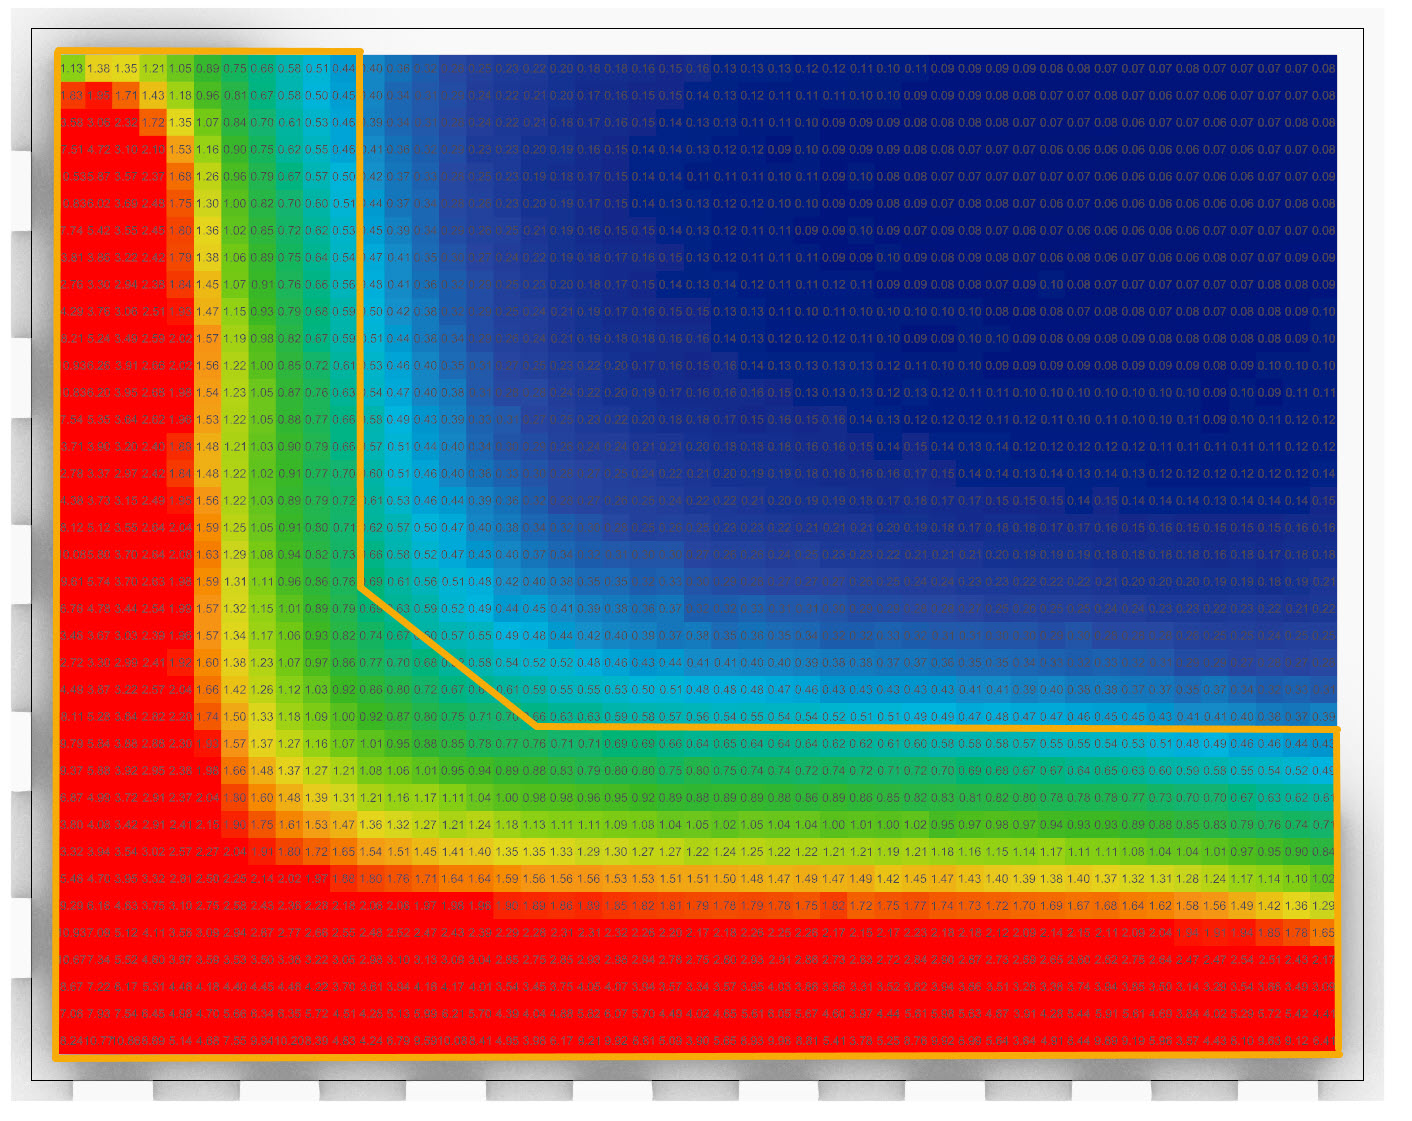
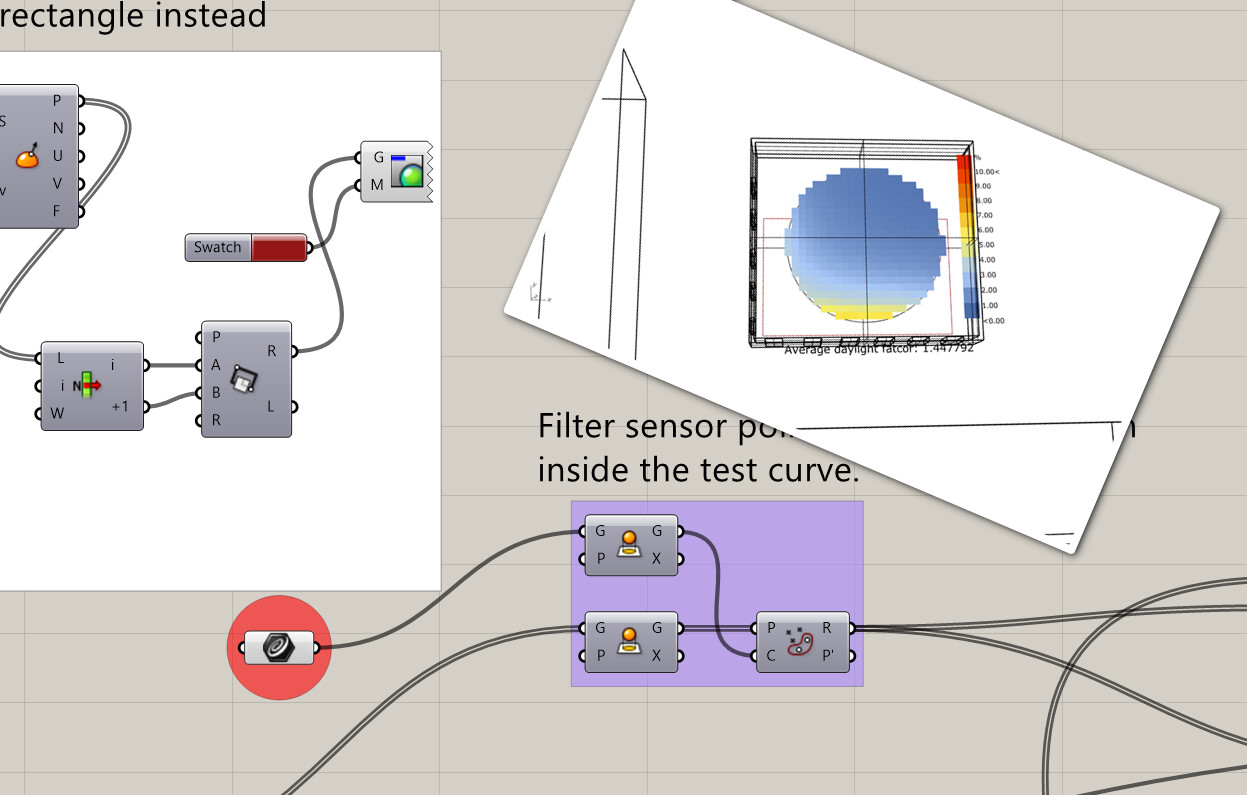
In the picture below, I’ve calculated the daylight factor for an entire floor. Realistically speaking, placing desks will probably happen within the orange lines.
Does anyone know if it is possible to/have an idea how to “recalculate” the average daylight factor, over another “curve/surface” after running a LB-Radiance simulation?
The easiest way is to draw a new curve/surface and rerun the simulation, but I wonder if it’s possible to utilize the results that we already have from the simulation of the whole floor, instead of running a new Radiance simulation.
This has been asked before on the forum - here is a sample file that shows how you can remove mesh cells based on the values and get the area of the rest of the floor plan that meets the criteria.
Hi @mostapha
Thank you for a quick reply!
I’ve used the “MeshSelector” to perform the same as in your example. I think it’s pretty much the same thing?
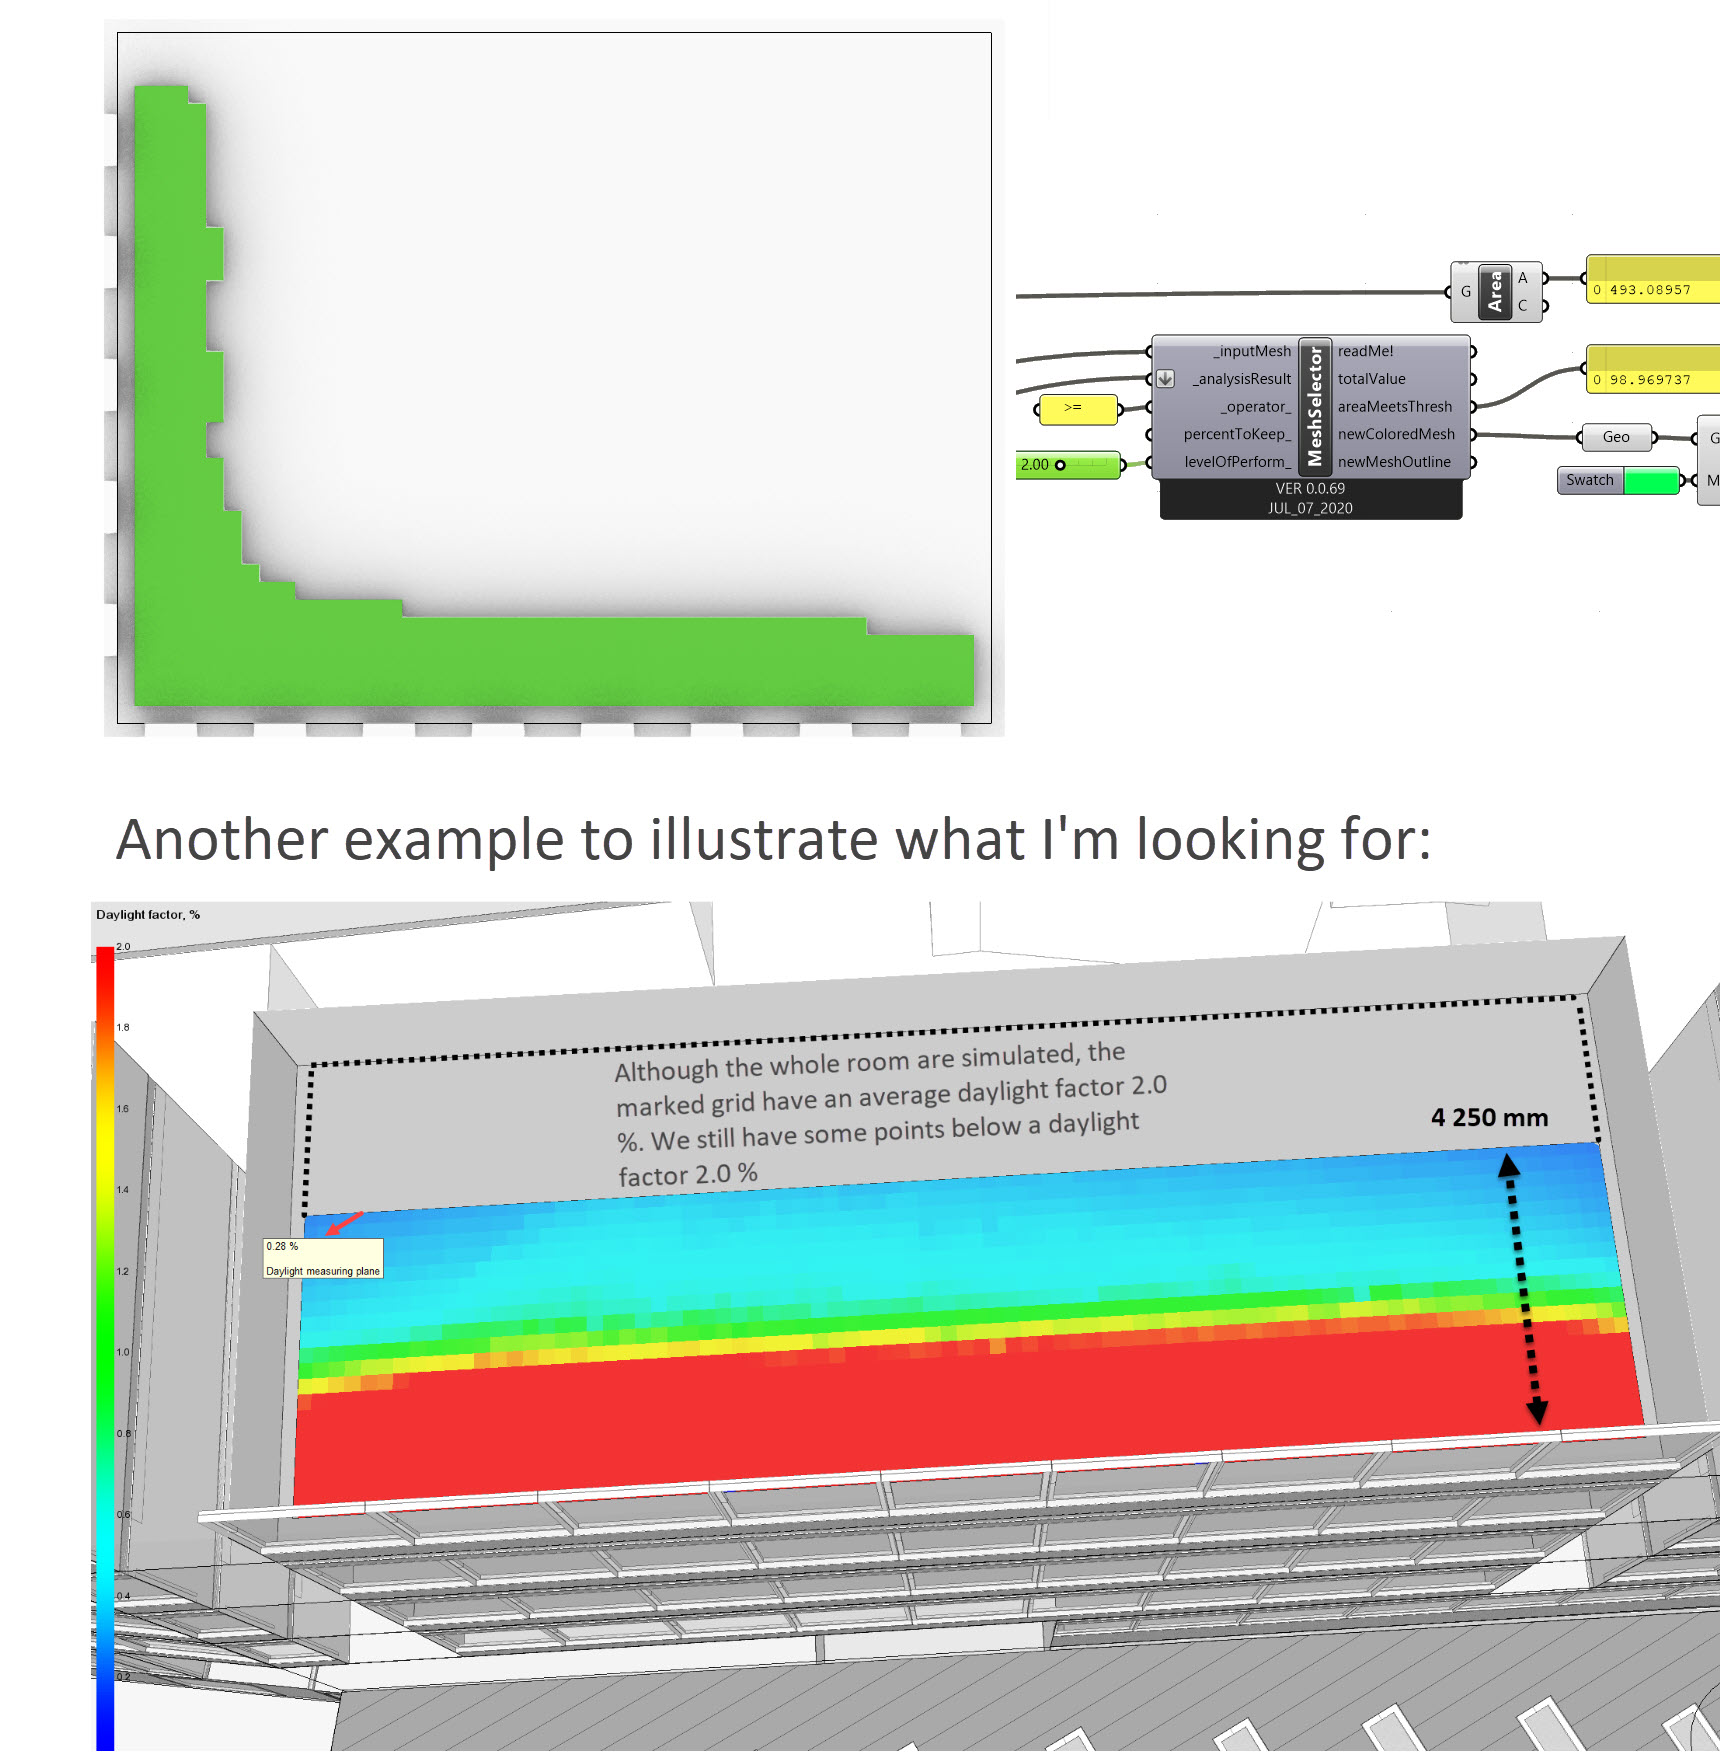
What I would like, is to show the area of the test grid that achieves 2,0 % in average daylight factor.
That means that some part of the area will receive more than 2,0 % and some under.
You could of course use “MeshSelector” to find the area that achieves a daylight factor ≥ 2.0 %, but that would be some what conservative. Our building code states that workspaces must have ≥ 2.0 % in average daylight factor (over the entire workplace), to meet the requirement. That is our aim.
I’ve tried to visualize the situation in the attached pictures.
Thanks. You can totally do that by post-processing the results using Grasshopper components but there is no single component in Ladybug Tools to do that for you. Do you have a simple example file that you can share which I can use to build the post-processing?
@mostapha, @EspenHansen
FYI, I’ve seen this kind of averaging typically done using iterative contour maps for daylighting, i.e:
If you made a histogram of each point in the grid (i.e. you sort and “bin” the points according to some constant interval of daylight factor), then each “bin” in the histogram would represent a contour. Cumulatively adding bins in reverse would then represent decreasing your average daylight factor by expanding it spatially from your brightest points.
Anyway, if you do end up going the histogram direction Mostapha, I just wanted to mention there is a histogram module in Ladybug.
Hi @mostapha
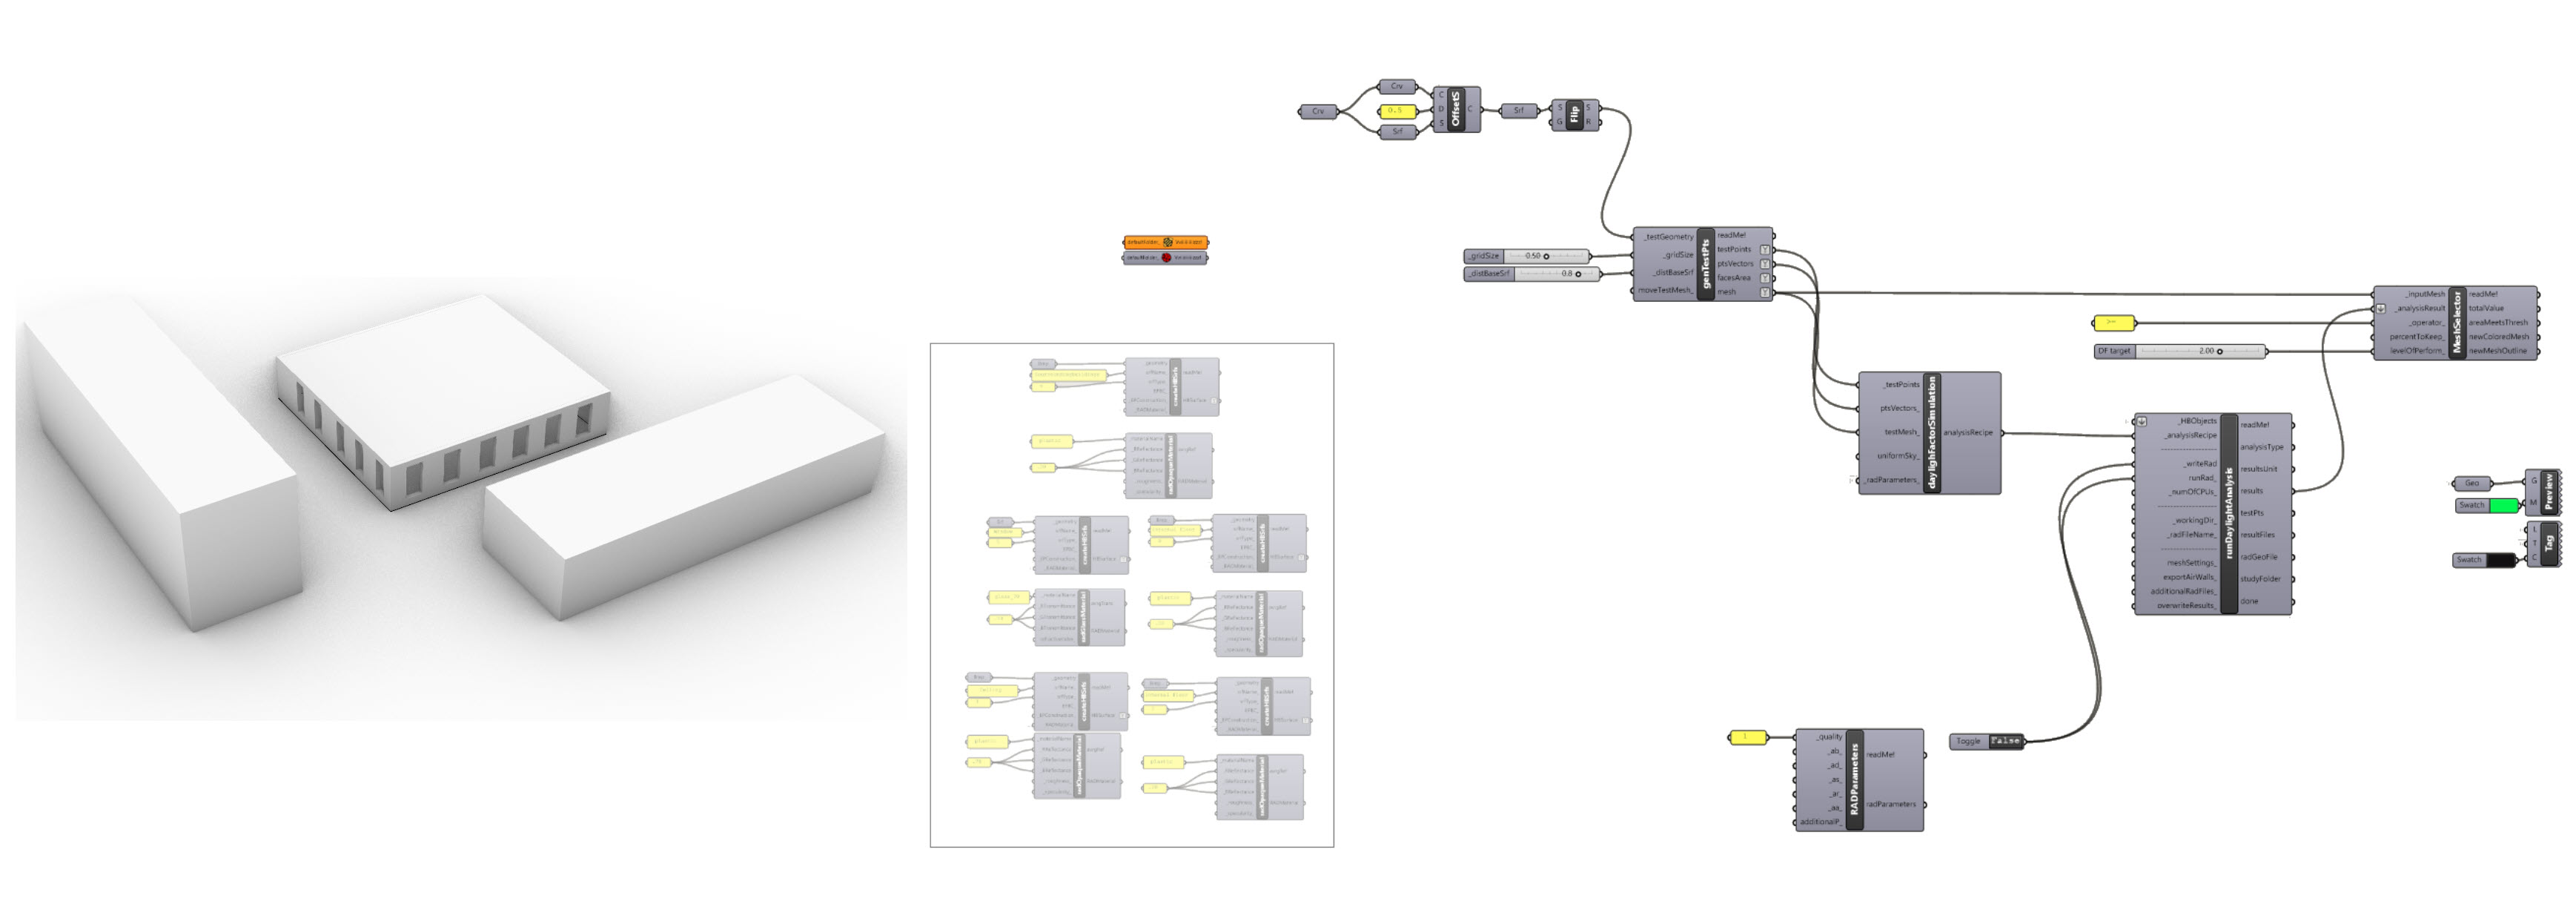
I’ve uploaded a simple Rhino example and a daylight factor calculation gh.
I’ve also attached a picture of the example.
Please let me know if you need something else.
Simpleoffice.3dm (402.2 KB)
Daylightfactor.gh (502.4 KB)
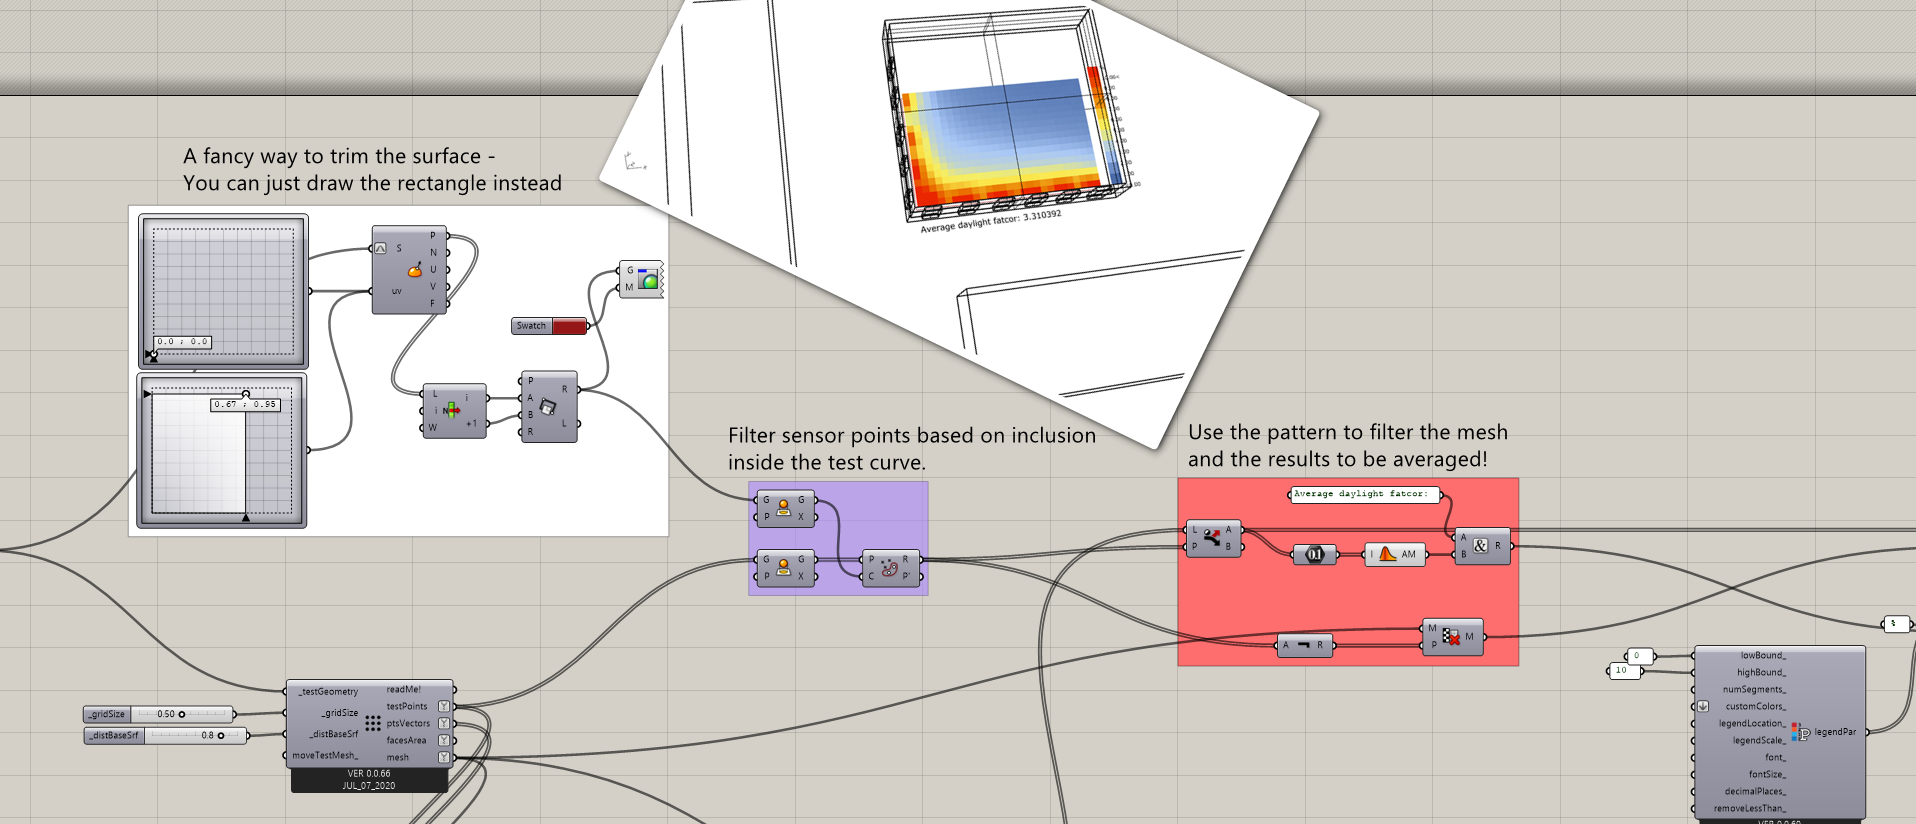
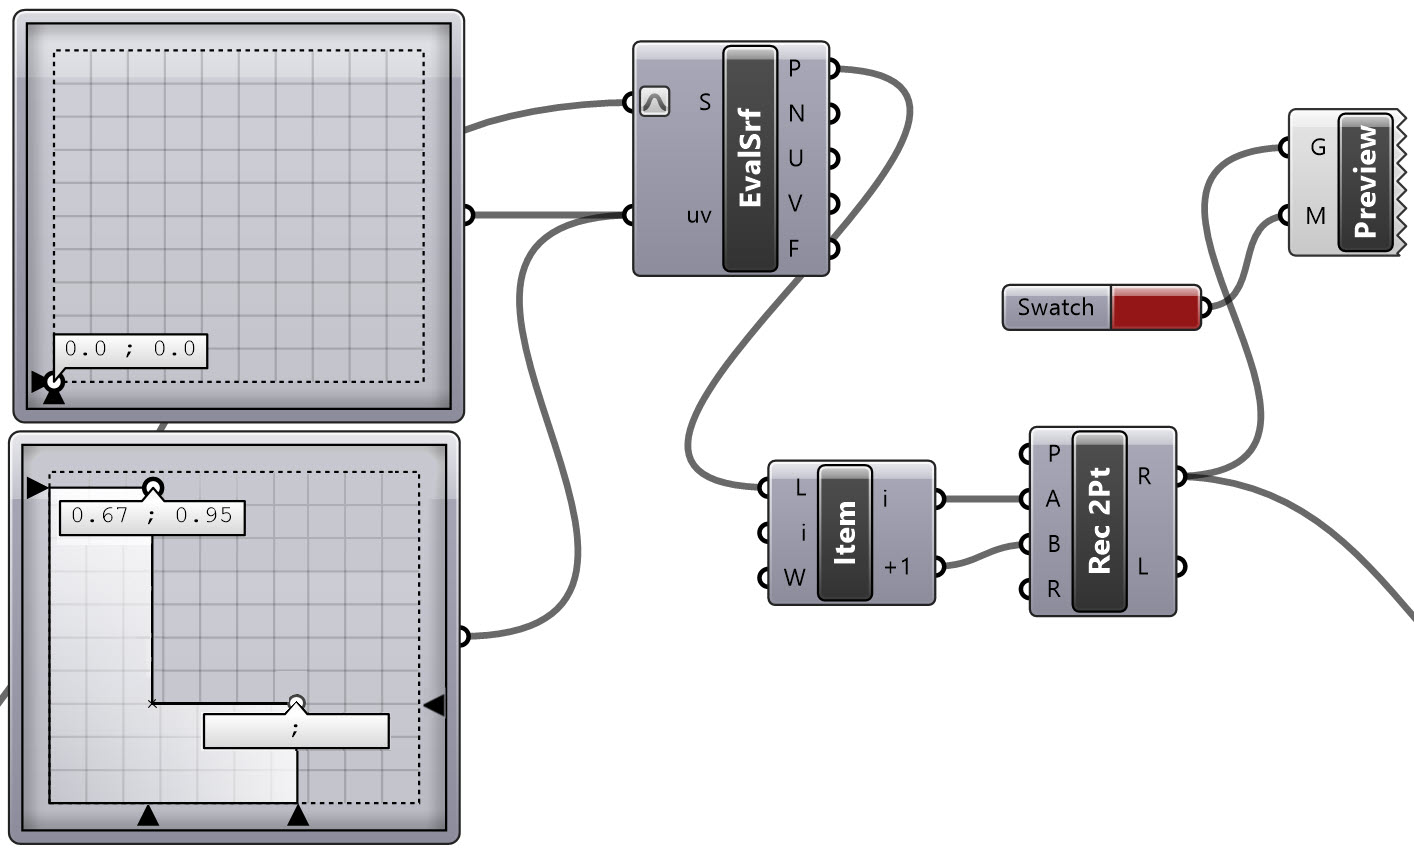
There are probably smarter ways as @SaeranVasanthakumar suggested but I just put a solution together which I think is more grasshopper(y) way of doing it!
You can just move the sliders and watch the average value. There are ways to automate finding this area even more but this should be a good example to get you started.
Daylightfactor_msr.gh (519.3 KB)
1 Like
Hi @mostapha
This is a good start. Thank you!
If you choose to take it a step further in the future, e.g adding the possibility to have custom shapes at the MD slider/histogram direction, please let me know 
You can do that already. Just draw the curve and connect it to where the rectangle is connected right now.
Wonderful! Thank you so much