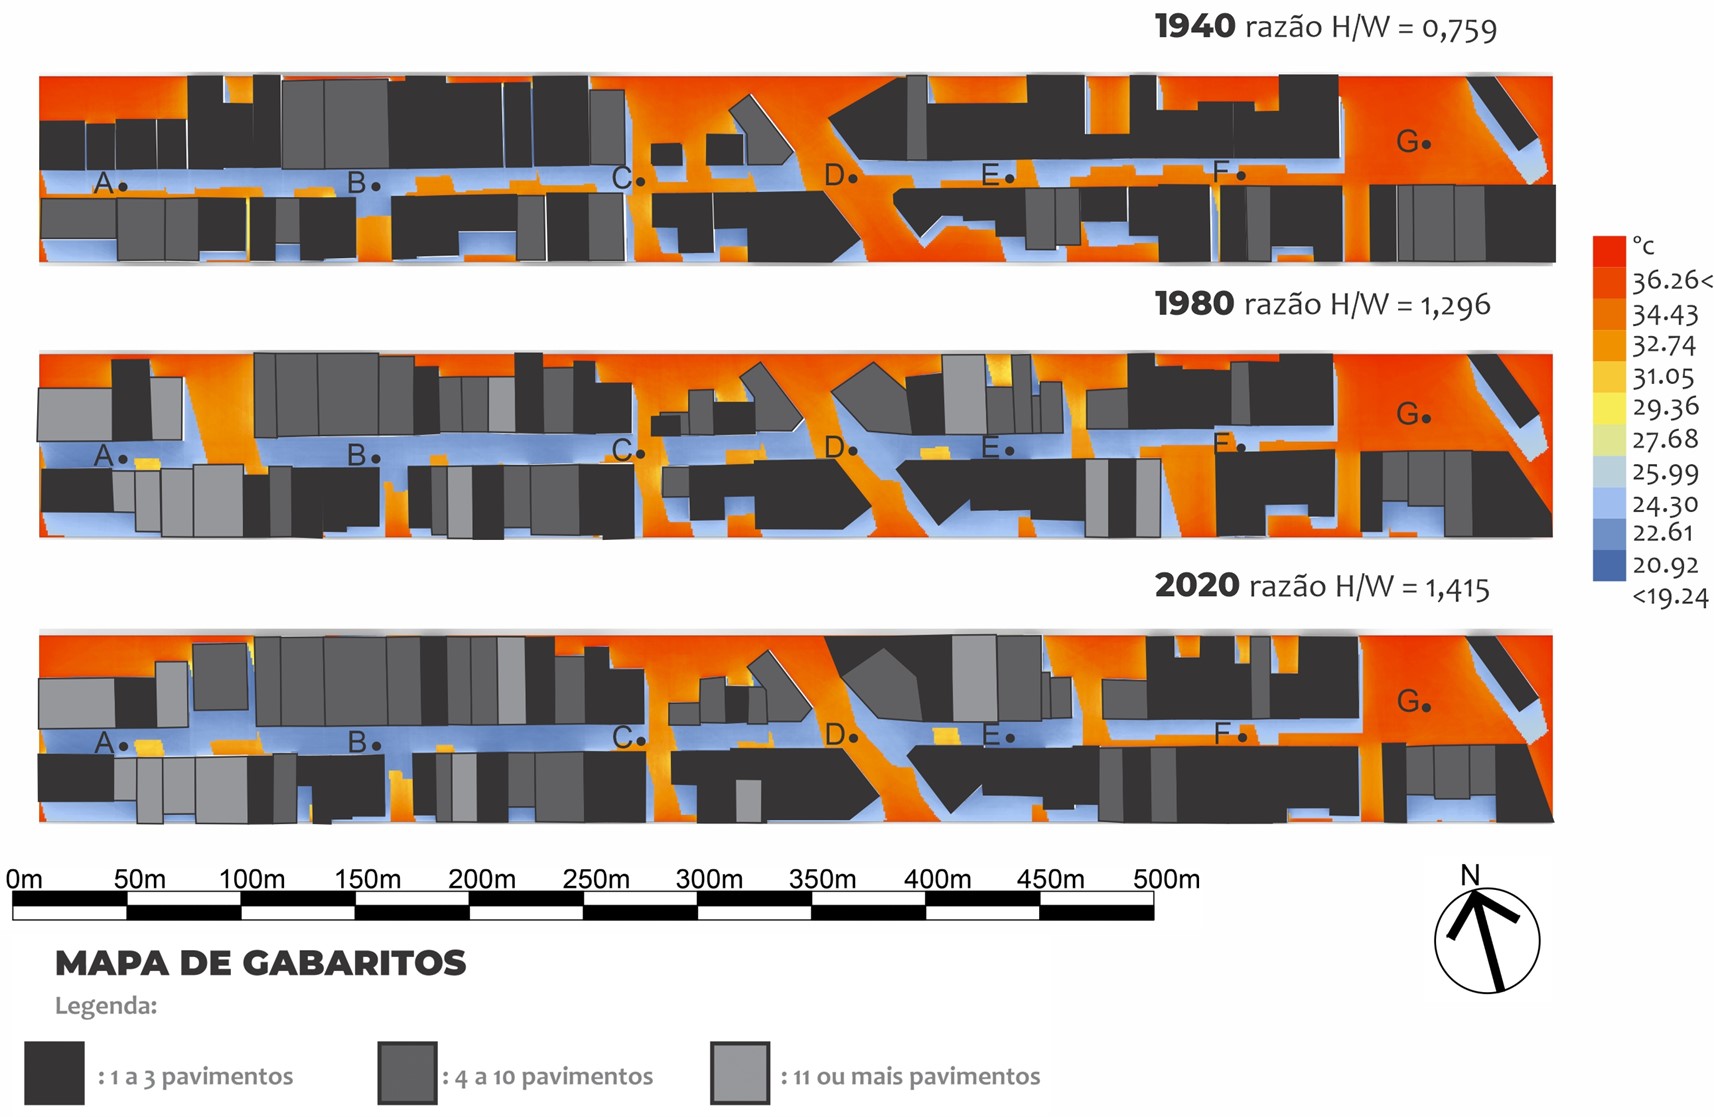
Hi everyone, I’m trying to perform an UTCI analysis through honeybee on an urban canyon in my city for an article I’m doing, I’m trying to obtain the values for the UTCI index on sunlit areas and shaded areas from the canyon from points that I established throughout the canyon such as the image below, by the points from A to G.
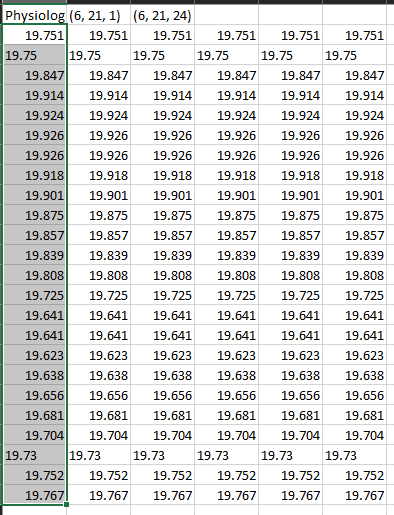
But when generating the .csv file off from the analysis recipe, the values are all the same for each of the 6 points, for sunlit and shaded areas through every hour of the day. (I know that on the image is showing the PET index, but this error is happening to every index I use)
Is there another way that I can obtain these values correctly? Is it possible to extract the values separately from the mesh showed above? So I can make graphics showing the UTCI spacial difference?
Here’s the file I’m using with internalised data. UTCI ANALYSIS 14-04.gh (875.2 KB)
Thanks everyone for the help as usual.
Regards.
D.C
Sure indeed! Here it is, this one is the .epw for this analysis period, my research I modelled this urban canyon for 1940- 1980 and 2020, this is the .epw for 1940.
And this is the list with 8760 values of wind speed Ventos2.csv (41.0 KB)
The funny part is that the wind values list does not work with multiple columns, with a single one it works (this wind values list was extracted directly from the .epw)
It’s strange. I plotted UTCI and It appears I do get different values. I am not able to recreate this error at my end. SERAQFOIESSECARAIUTCI.csv (2.0 KB)
I would check units and tolerance first. I am using meters and tolerance of 0.01. I also moved points 1.2 up from their original position which was inside your ground zone.
Now it worked! Changed the tolerance and moved the points to 1.2m. UTCITESTEV2UTCI.csv (2.0 KB)
The only thing that still strange to me are the Air Temperature values, on the gradient maps and also the .csv the values are still the same to every point. The temperature is only accounted towards the interior of buildings, does that have something to do with the settings I’m using maybe? Here’s the .csv UTCITESTEV2AirTemp.csv (759 Bytes)
I will need to think more about it but I am not too surprised that the air temperature across those points is the same at a certain hour. To me, the reason seems to be that the workflow in the script does not account for the direct sun. Here is a good example. I believe that is the direction you should take.
Thank you so much! I got a single question left, I have gone through the Simple Spacial UTCI example file you mentioned, but I can’t extract a .csv file like you can do with the Analysis Recipe from honeybee, is there some kind of workaround I can do on this component to extract a .csv file from Ladybug like you do with Honeybee? Maybe use a Excel plugin for Grasshopper?
I use Bumblebee to work with excel. With this plugin, you’ll be able to write UTCI values to an excel file. I also used this plugin to load the wind velocity values that you shared.
Last question! (I promise hehehe)
Does these UTCI values look reasonable to you? I’m using the EPW from my city from Brazil, my city has a altitude tropical climate, by 1AM the UTCI values are about 9.108ºC or less, is there some sort of miscalculation or something like that? Just saying because our climate here does not reach 9ºC often, it is really rare actually, it is mostly sunny throughout the year, I thought that the values would be higher
Really appreciate your help Devang! It will be trully important for my masters degree