Hi !
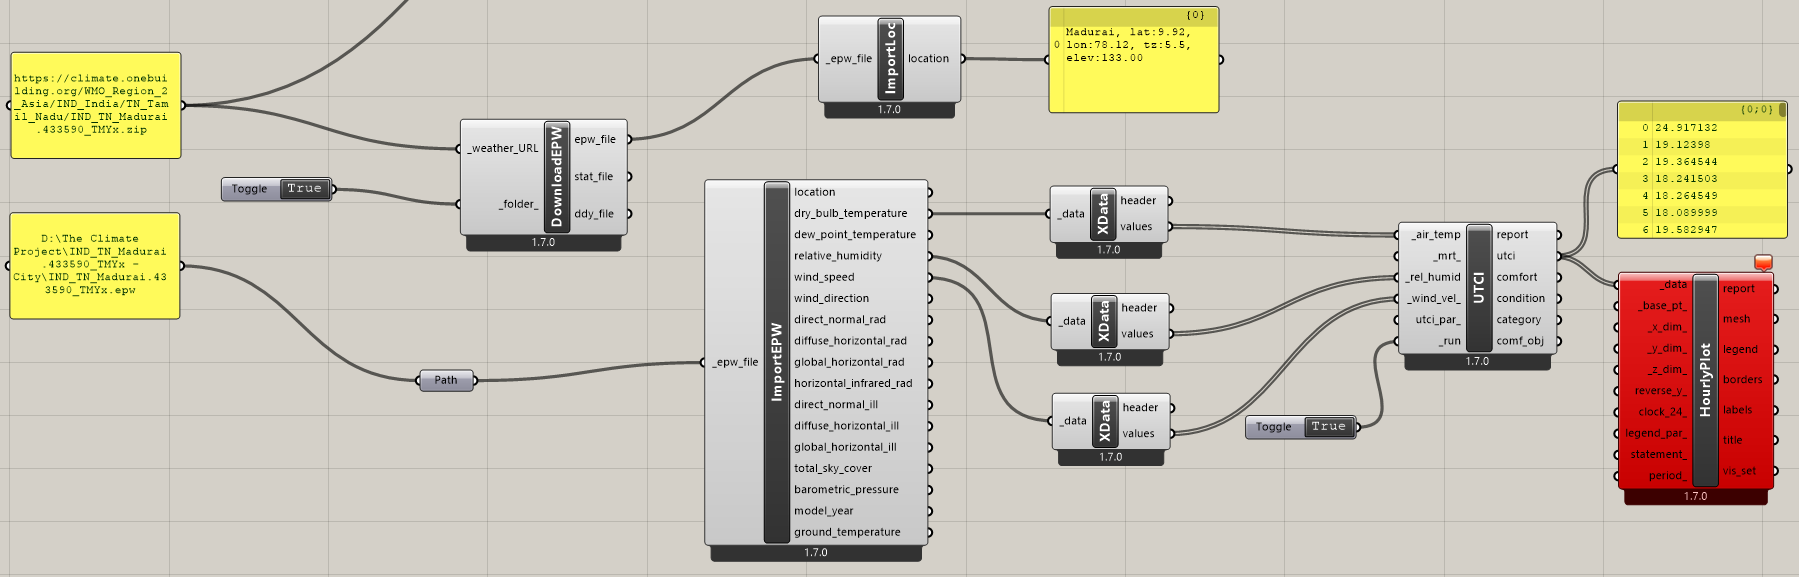
I am trying to visualize the UTCI as a graph, from an EPW file for the Indian city - “Madurai”. But I’m getting an error in the Hourlyplot, when I connect the node from UTCI to Hourlyplot. I’m not sure if it is because of data deconstruction in previous steps.
I have attached the screenshot. Any help or way out will be appreciated.
Error message - 1. Solution exception : HourlyPlot data_collection must be a HourlyContinuousCollection or HourlyDiscontinuousCollection. Got <type ‘float’>.
Thanks in advance.
Hello!
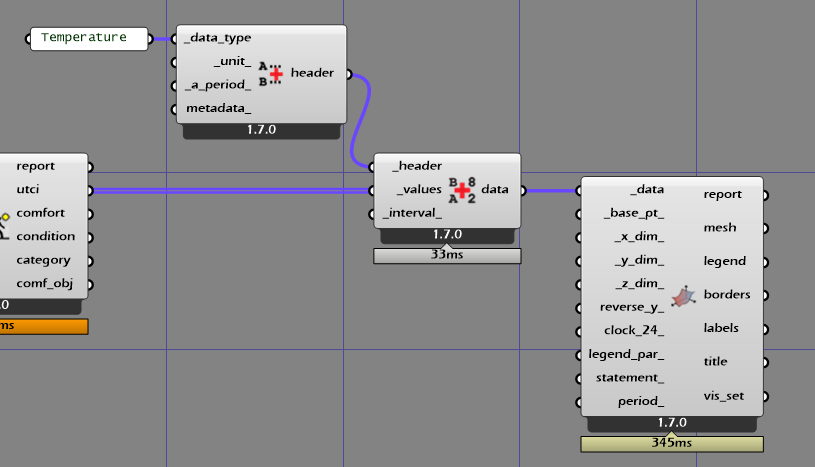
Just like you deconstructed data from the download EPW component, you need to reconstruct data to use in the hourly plot, not just raw numbers.
file can be downloaded here
ucti_data_tf.gh (29.0 KB)
-trevor
Didn’t test it but i think there is no need to deconstruct the data. Just connect the data collections straight from the epw component. Probably the output will be also a collection.
-A.
This worked a charm. Thank you Trevor !
Thank you Abraham, this works too. Didn’t work previously as I missed to connect the _run data.