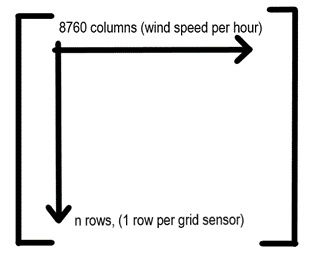
I am using the HB UTCI map component and for the wind speeds I have results from an external simulation in the format of the csv matrix shown below:
The matrix contains 8760 columns per sensor point since it has values for each hour annually. But If I am using a run period that is for a week instead of annual, do I have to change the csv matrix to only have columns corresponding to the hours in the run period? or does the component automatically only use corresponding columns?
It says in the in the description that it should only contain a column per timestep of the run period but the simulation worked using the annual wind speed matrix and I am unsure if the right wind speeds are used? Is there a way to check the wind speed values used after the simulation has ran or even plot it?
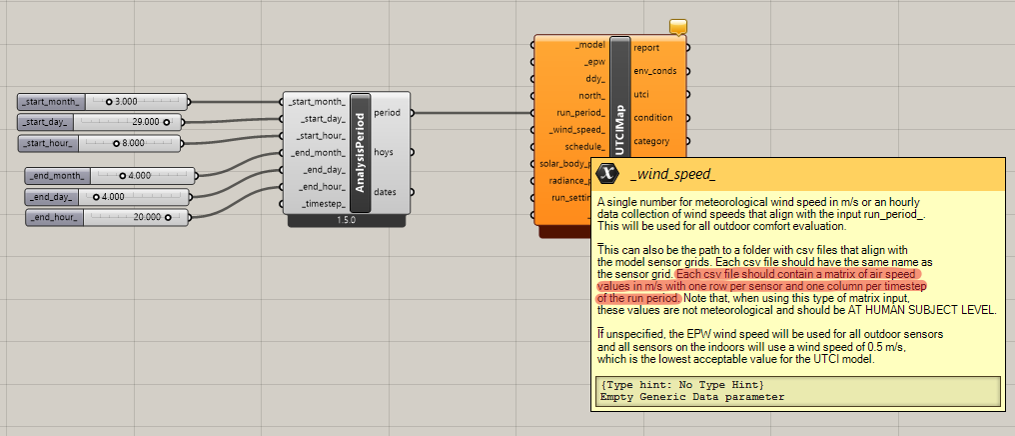
Sorry for the late response and I think you see the answer to your first question in the wind_speed_ input description that you highlighted. It is supposed to be just for the run period and not for the whole year. The routines inside the component are just going to assume that the wind speeds in the CSV start at the first hour of the run period and not on Jan 1 0:00.
Just because it simulated does not mean it’s correct. As I said above, just follow what the component input says and you’ll get a correct result.
Unfortunately, because not all of the comfort models use meteorological wind speed, we don’t have a dedicated Grasshopper workflow for this with all comfort maps but you can your input wind speeds interpreted into matrices that align with the other environmental conditions (eg. MRT) in this location: