Hi everyone! I’m an OpenStudio and Energyplus user and have been using it for Energy Simulation. However, I want to show the results of my energy simulation especially the indoor temperature gradient (operative temperature) and also the adaptive comfort map.
After simulating with energyplus with model from OpenStudio in Sketchup, I have several files such as the IDF, CSV, OSM, and also SQL file. Is it possible to view the results without doing the simulation through Honeybee?
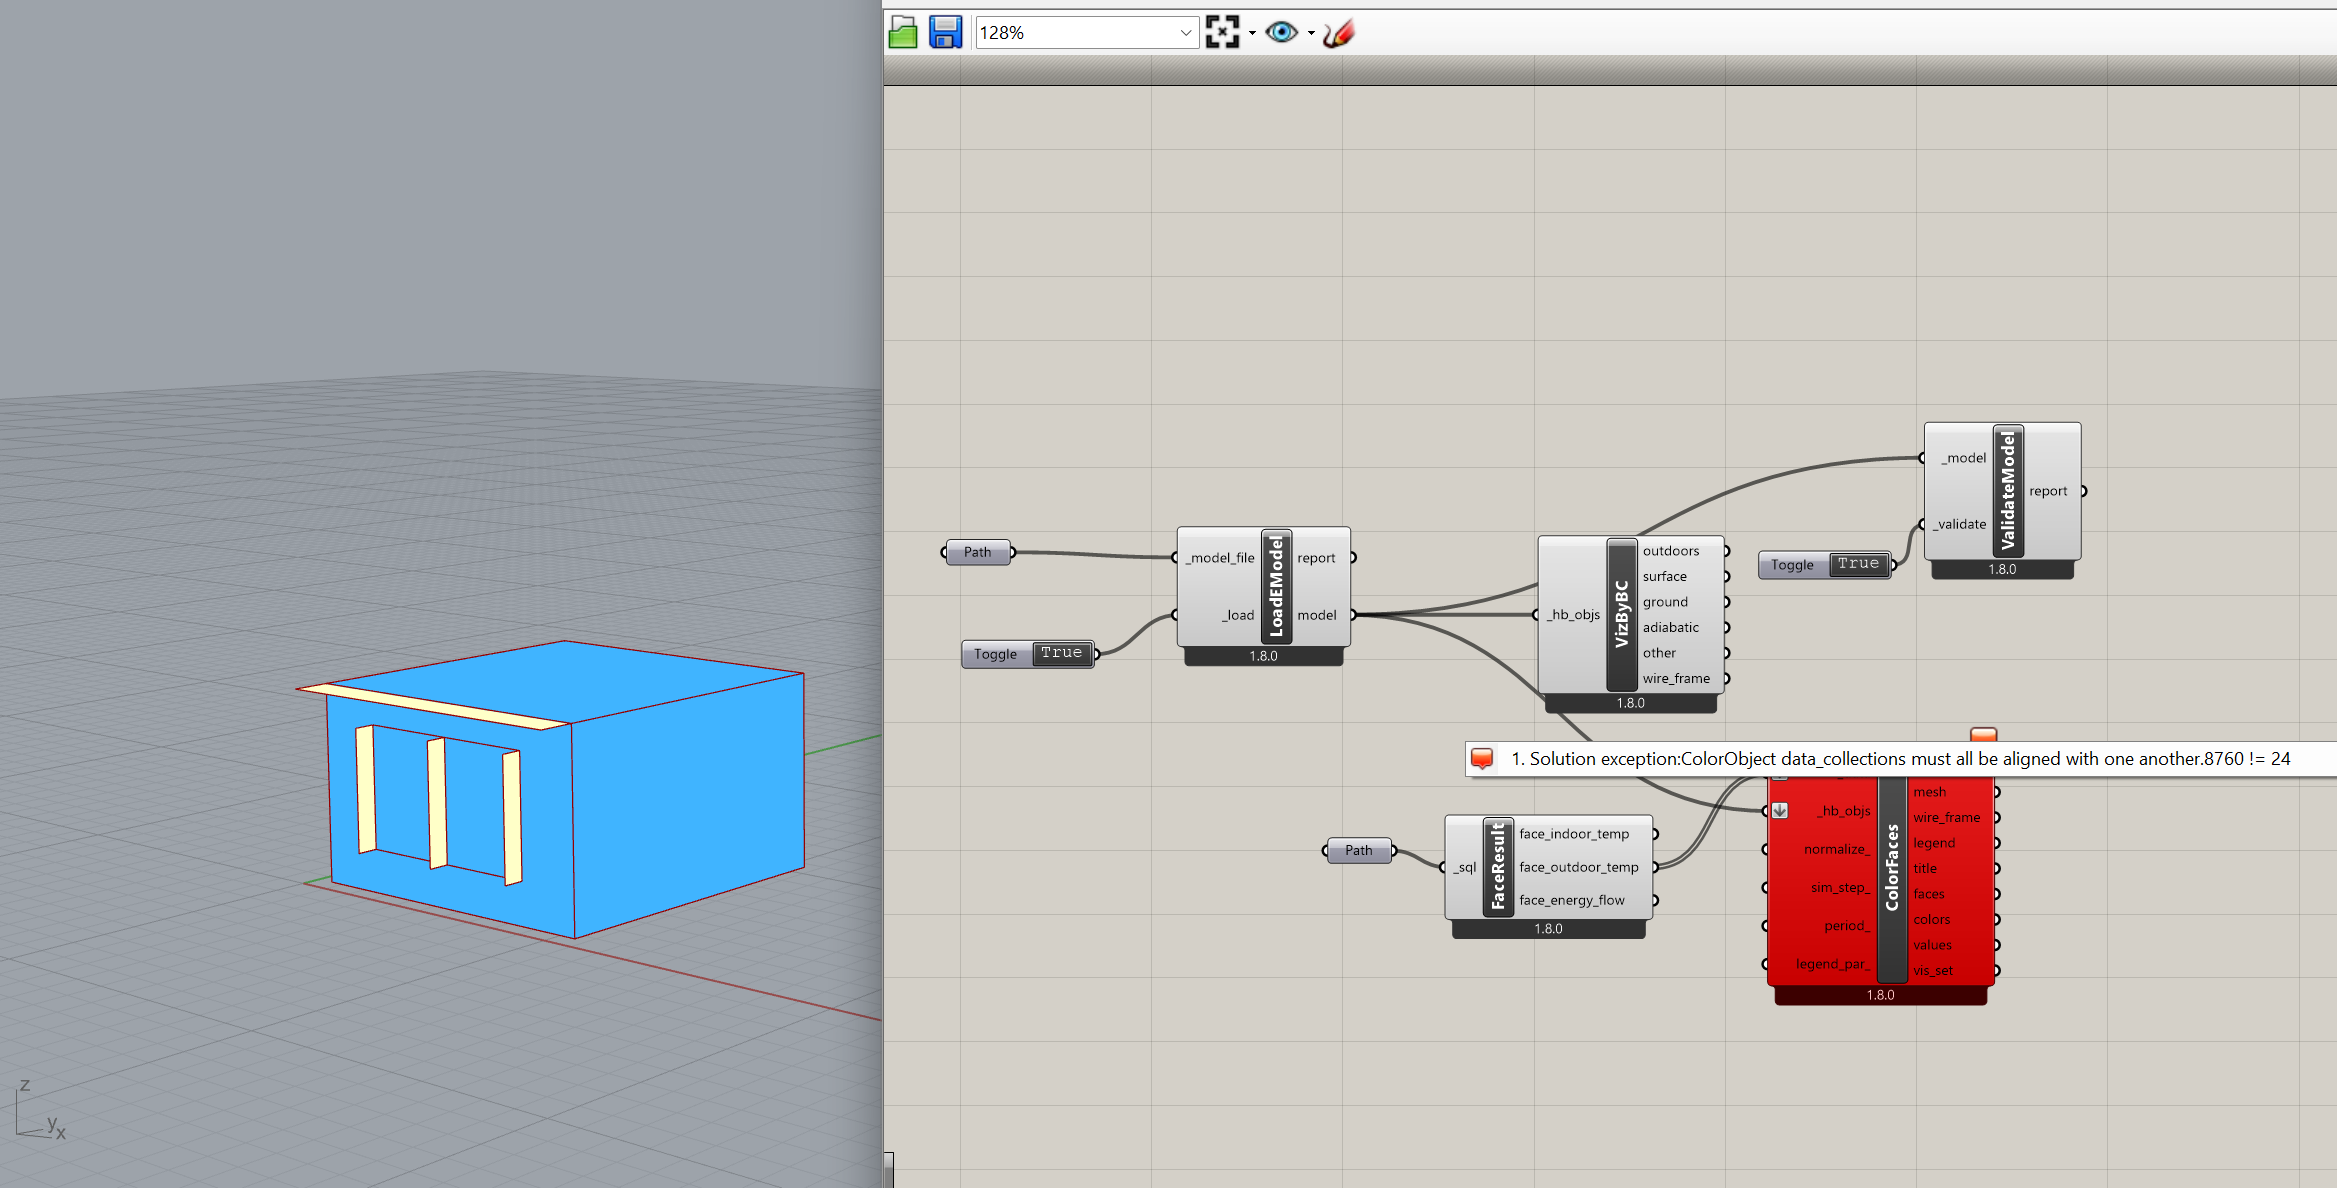
I’m not very familiar with Honeybee and Grashopper but I have “tried” loading the OSM and SQL file. However, I got this problem:
If it’s actually possible, is it possible to show the gradient of the temperature in Rhino? I have heard that the outdoor and indoor surface temperature is just one temperature data and can’t show the difference of temperature on different area under one surface.
Thank you so much in advance ![]()