I have found another feature of the visualisation set option that i do not understand.
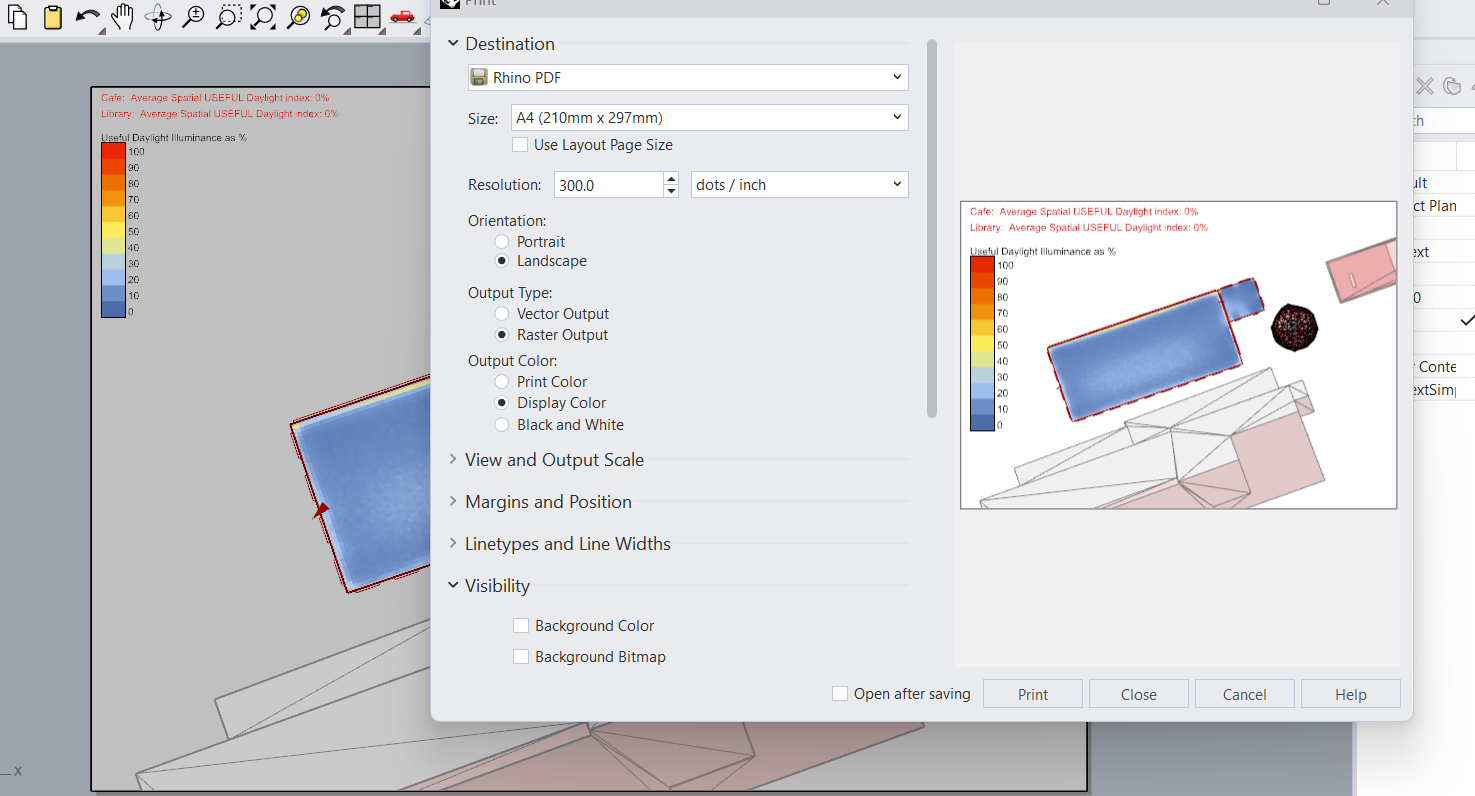
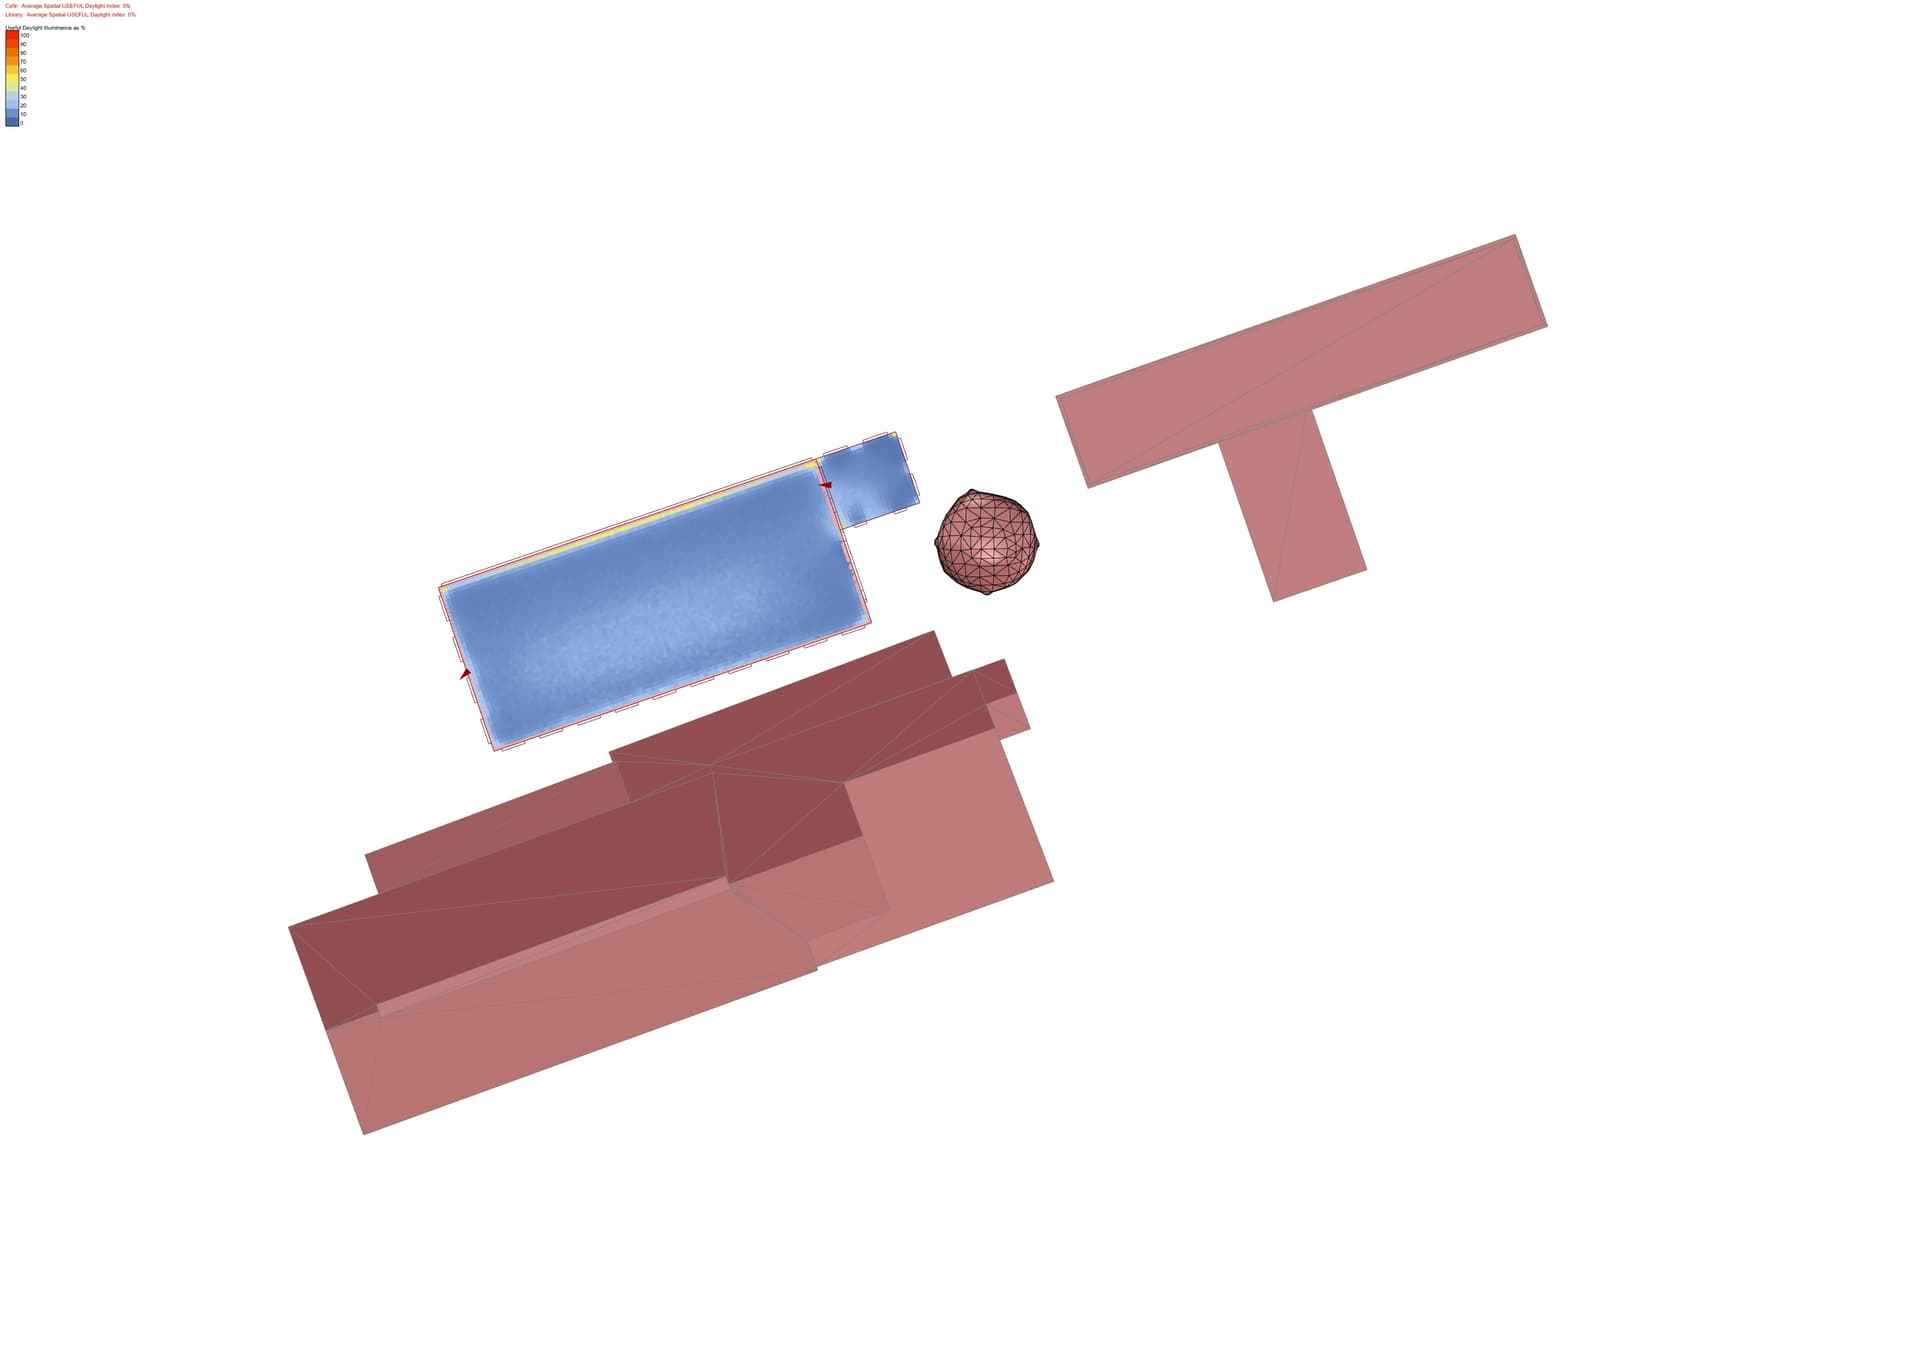
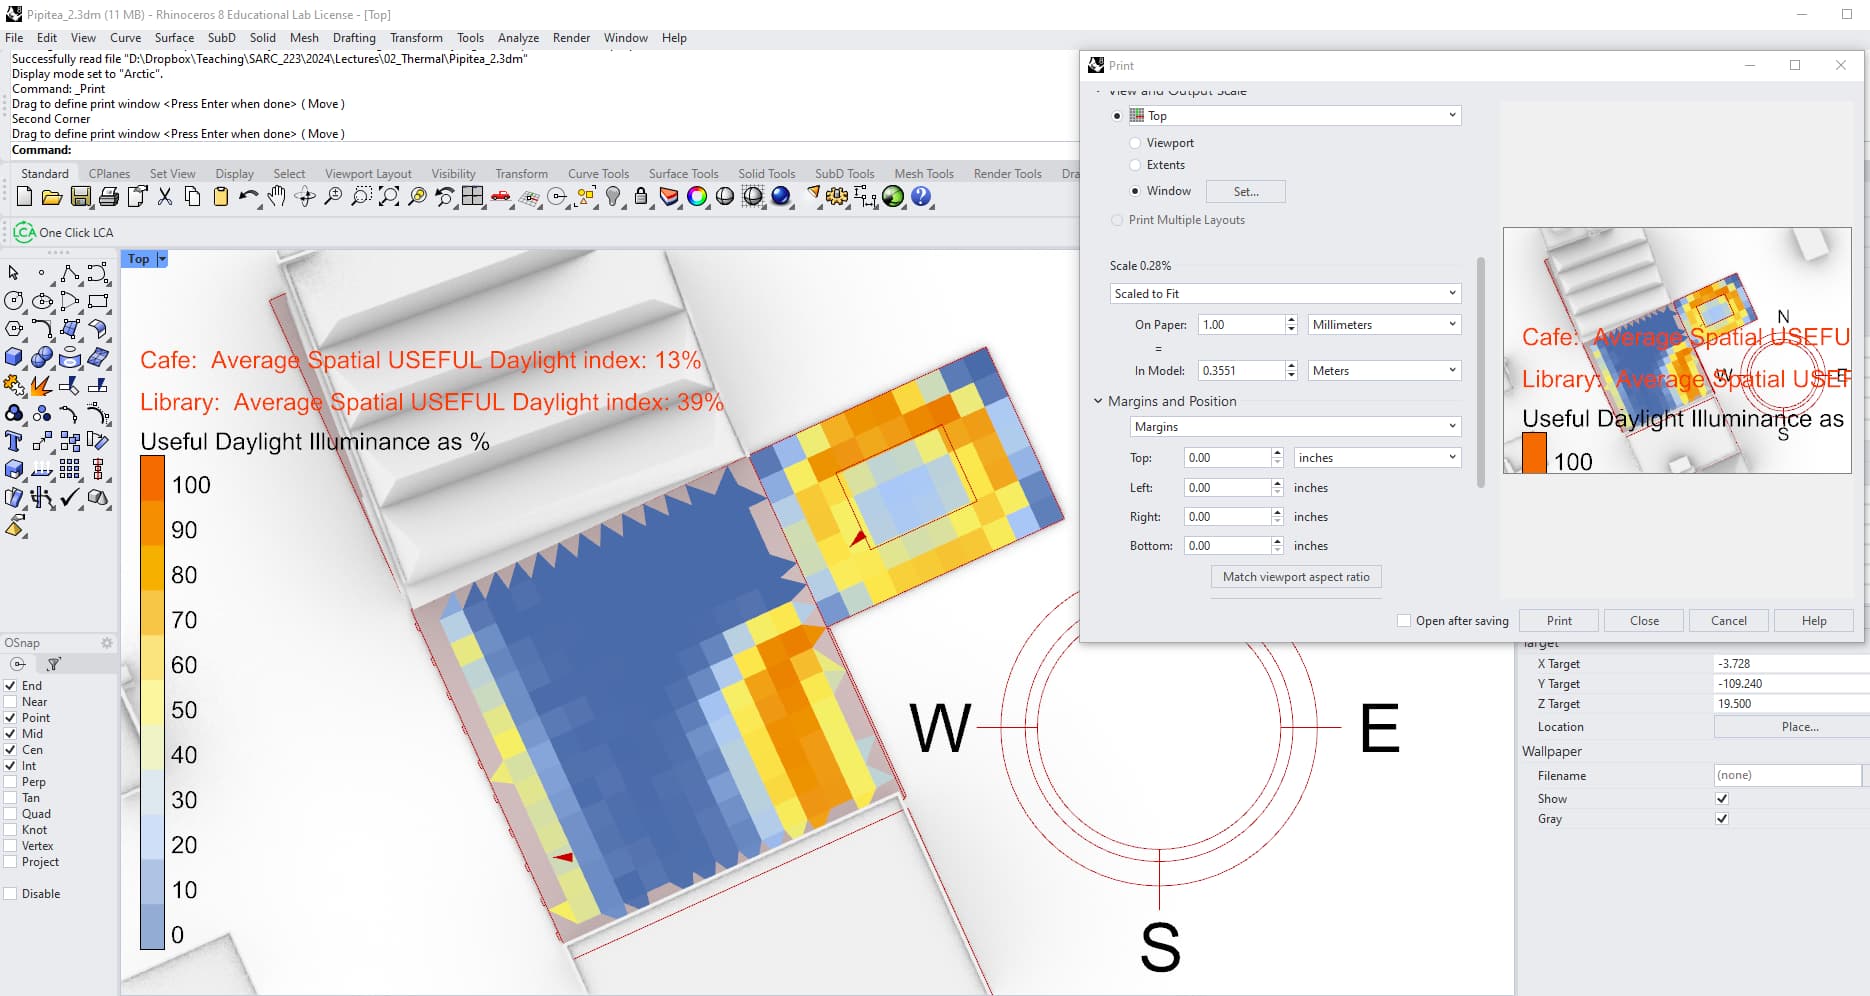
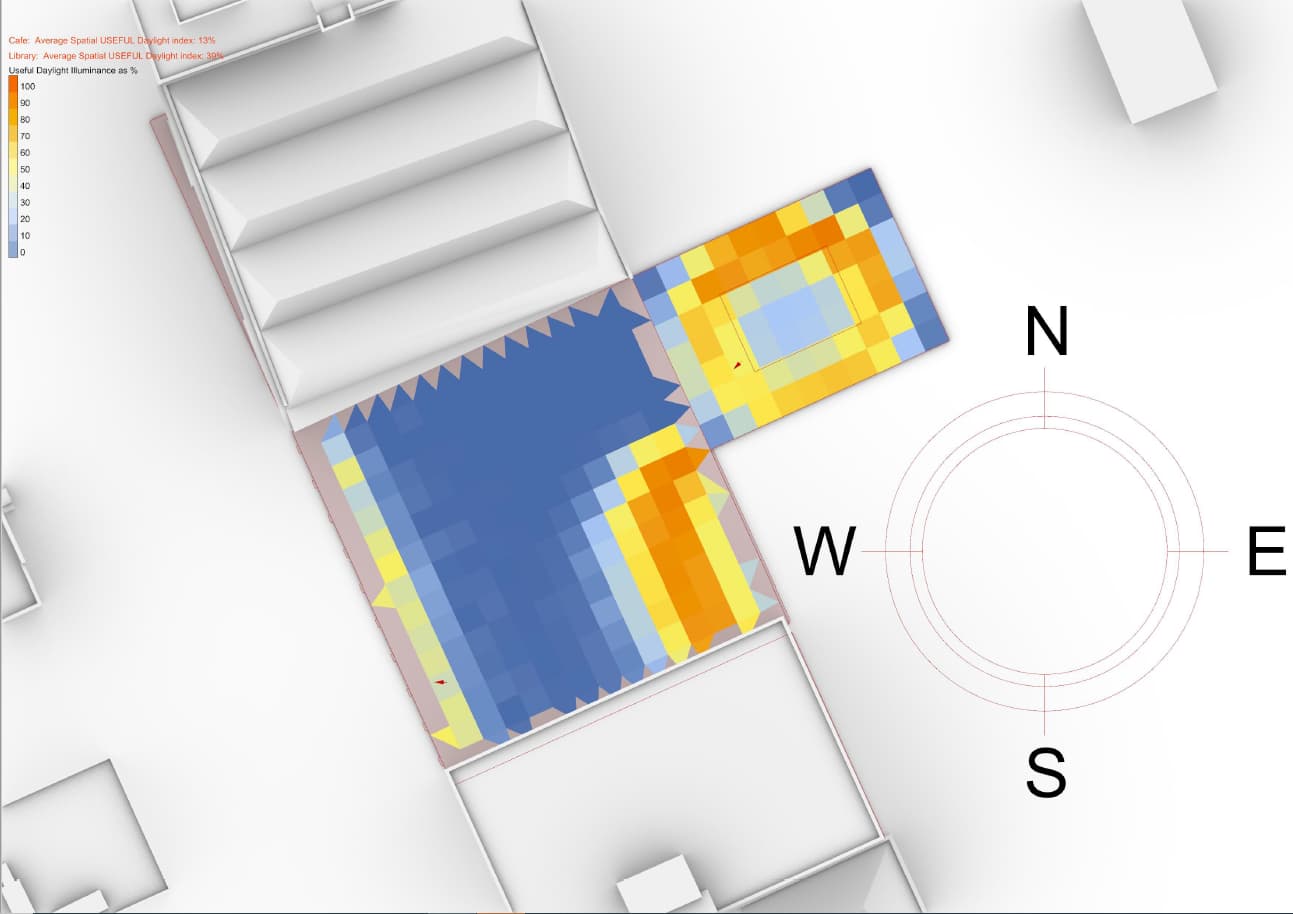
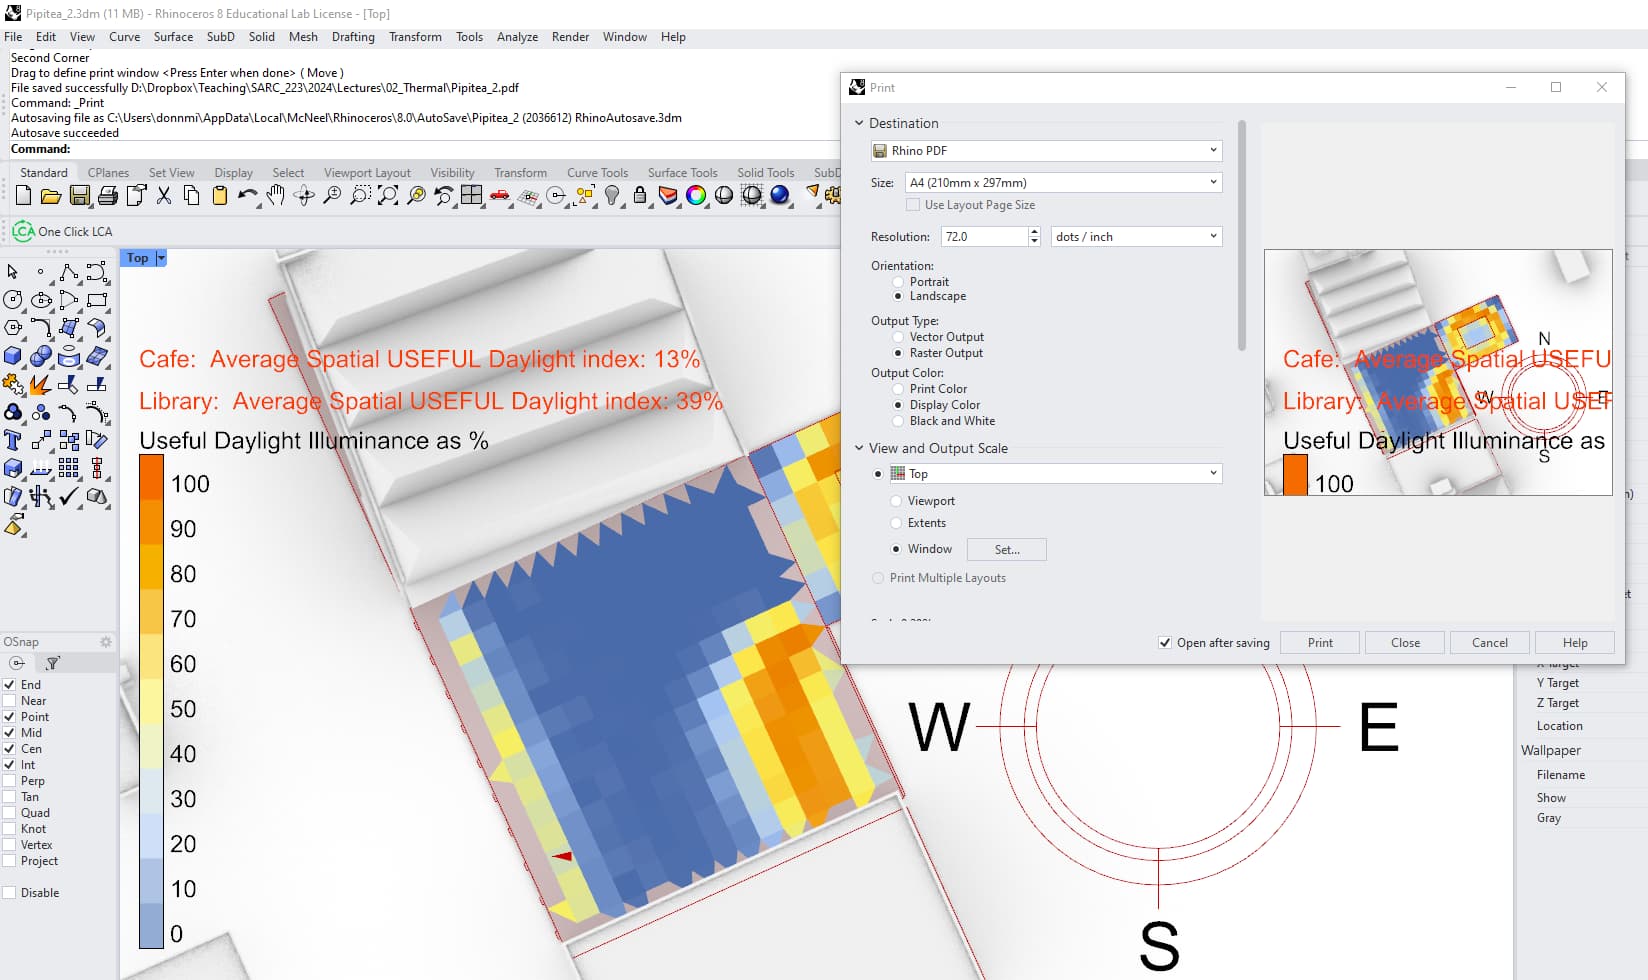
When i use any of the Rhino print options the window i am currently finding that, no matter what scaling or viewport options I choose, the legend is shrunk but the model or graph being “printed” (to an image file) is the correct scale?
It’s a little tough to know exactly what you are talking about without some images, @MichaelDonn, but maybe what you are seeing is the differentce between screen resolution, which tends to be around 72 pixels per inch (PPI), and print resolution, which tends to be around 300 dots per inch (DPI). What happens if you change the print resolution to 72 DPI?
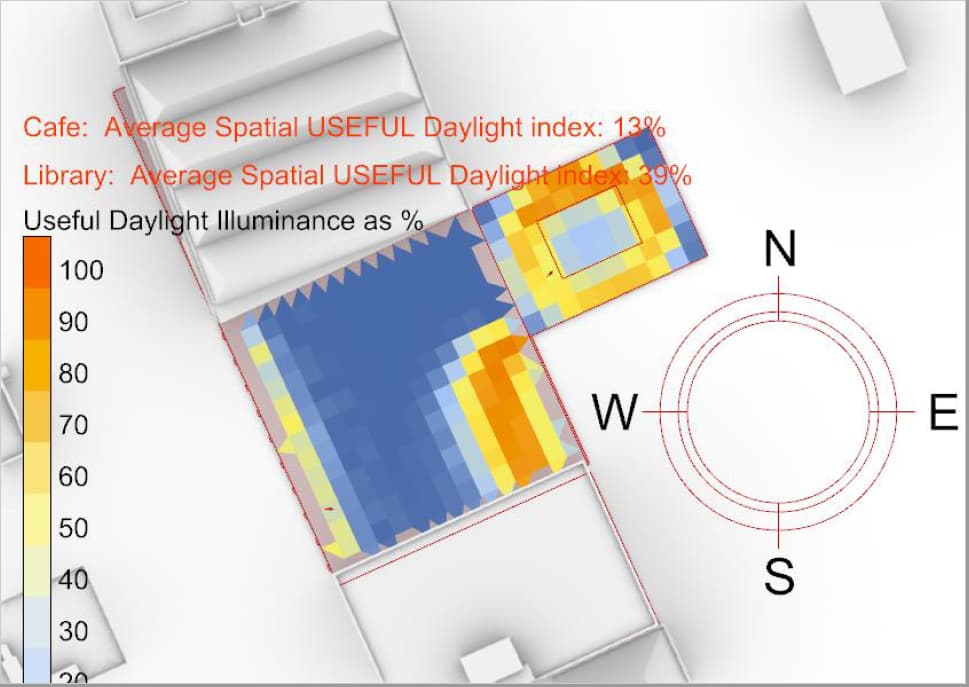
My bad. I should have at least incorporated the student’s illustrations.
She posted:
I’m having a problem where I’ve adjusted the settings of each of the bars in my analysis to the rhino print, but when I open the image on my computer, the bar is super small. Is there a way to fix this? It happens no matter how I print it (pdf, jpeg, png, etc).
You are correct, the dpi has a huge effect on the printed output. I think I have a work-around for the student (other than the screen capture I have suggested previously). But, this has identified in my mind the issue is that the image preview in the Print Dialogue window is the major issue! I suspect a Rhino issue, not your focus.