Hi there
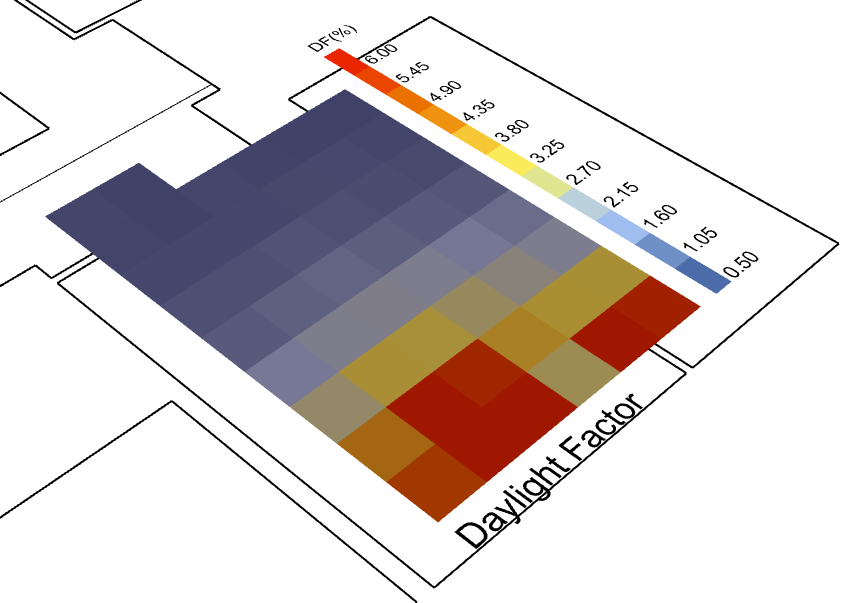
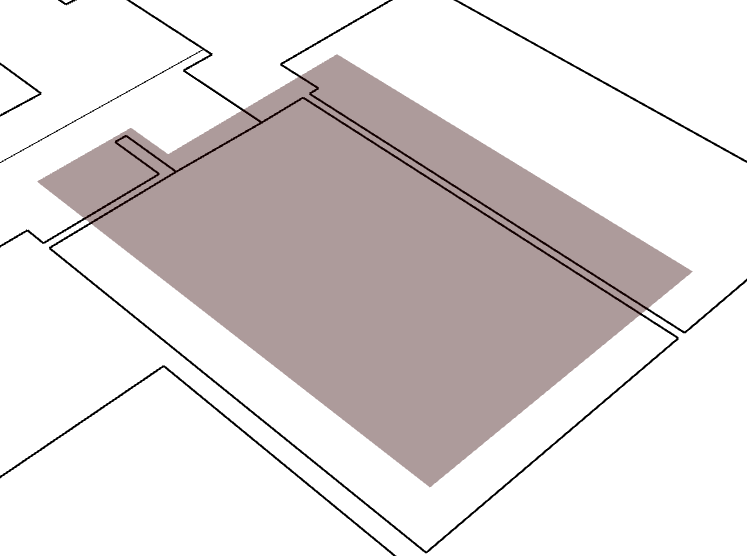
I don’t seem to be able to avoid displaying the grid from a daylight calculation in Rhino, which persistently shows as a grey surface and for that reason changes the colour of the heat map. This makes that the colours of the heat map to not match the colours of the legend. I would expect that showing the image in wireframe mode in Rhino would get rid of this grey area but it does not. I tried to switch off in Preview but the problem persists.
Someone has an idea of how this issue can be resolved?
Thanks
Raquel
Hi @Raquel, can you share a screenshot of your whole grasshopper canvas?
Hi Raquel,
Looks like you might have a grid/mesh component previewed in grasshopper - which doubles up on the results output and makes it duller. Try selecting all your canvas and turning off all previews - then preview the results component - if not might be a more complex issue.
Hi @LeightonSS55
I was going to swear I had done what you suggested but apperently not. It is in fact the Preview that was on. Thank you, it sorted it out.
Raquel
Thanks @charlie.brooker, it was the preview that was on - it is sorted.¨
Raquel