Hi Ladybug community
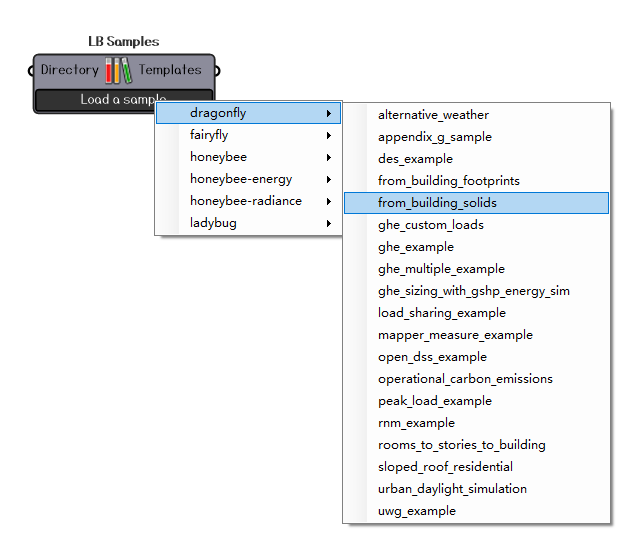
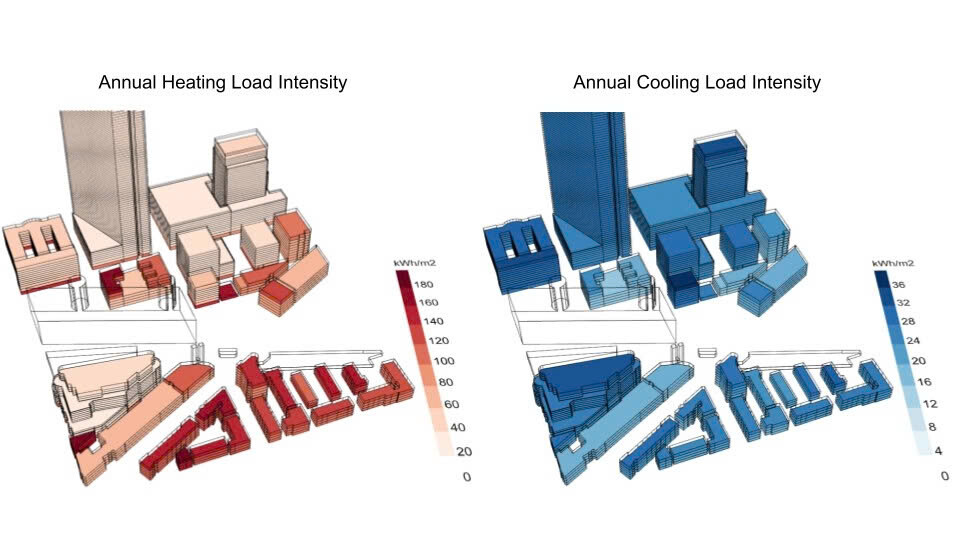
I’ve just finished UrbanOpt simulation, and now I want to visualize the heating and cooling energy intensity results of each building in my district, preferably different shades of colours can represent smaller and larger intensity values of various buildings like in this image my teacher sent me to follow.
Does anyone know how to do this? This is really important for my college project.
Thank you so much!!