Is there a way to visualize, .show(), or .plot() the HourlyPlot objects directly in python using the ladybug-core?
I am able to generate the object and see all the geometry elements via methods but I cannot find a way to display the results graphically in python or a window. Is this a feature available to the library at this time?
@Justin_Shultz
Good question. I’ve found taking ladybug out of GH and visualizing it with (vectorized) python libraries is a crucial step in any workflow where I’m working with >10 models. I noticed something like a 10+X speedup in visualization/plotting/analysis by doing this.
The best way to do this, in my opinion, is to just load the the underlying values from your ladybug DataCollection object directly into matplotlib/pandas functions and use their built-in plotting tools (i.e .imshow for 2D hourly plots). @AntoineDao started a project called ladybug_pandas that I believe does a more automated version of this, here: GitHub - ladybug-tools/ladybug-pandas: <3 A ladybug extension powered by pandas.
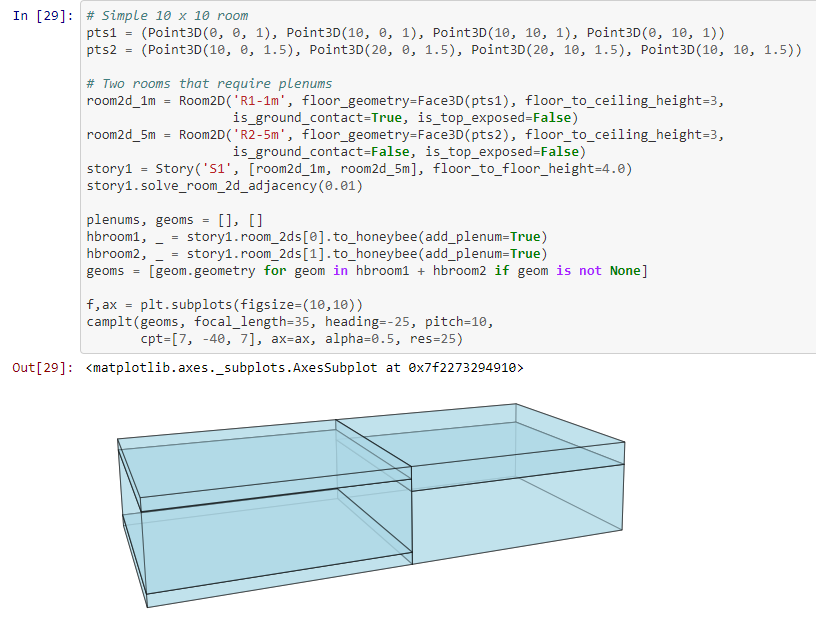
If you are also interested in visualizing 3D geometries, I’ve created a python library called Pincam that will display honeybee geometries with a simple 3D camera, available here: GitHub - saeranv/pincam: Lightweight Pinhole Camera for visualizing 3D geometries with Matplotlib/GeoPandas
It takes any list of 3D coordinates as an input, so it’s not made for honeybee specifically, but I use it all the time with ladybug geometries, i.e here’s an example visualizing Dragonfly Room2D geometries:
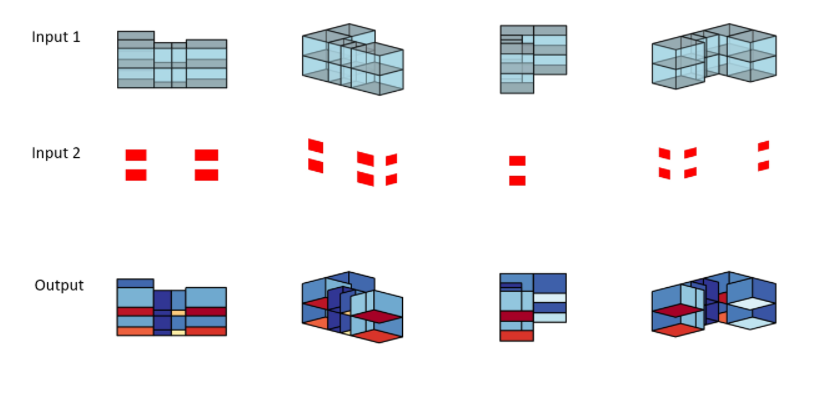
And here’s one with surface simulation results mapped onto geometry:
4 Likes
@SaeranVasanthakumar thank you for sharing, these are very helpful examples. @AntoineDao’s library is exactly what I’m looking for. I like the idea of stripping the contents for plotting in standard data visualization libraries, it opens up a lot of options for different graphics. Though I see the value is relying on grasshopper for some of the line work like a wind rose.