Hi,
Is there a way to visualize the annual lux values of each sensor point instead of the percentage of each daylight matrix, other than LB Hourly Plot in LBT 1.4?
Hi @MeghaSajeev,
What’s your end goal? Curious why Hourly Plot doesn’t suit what you’re doing.
Are you aware of the HB Annual Results to Data component?
@chris Yes, I used the component to get the illuminance data and got the illuminance values using the 'LB Deconstruct Data" component. I’m having issues with visualizing this data on the mesh. Is there a way to sort these lux values and visualize them on the mesh?
@charlie.brooker Hi, I wanted to visualise the lux values on the mesh.
@MeghaSajeev ahh I think I understand what you mean now.
Here’s a couple of ways of doing it, as Chris said, HB Annual Results to Data is the key to it.
Daylight_HourlyResults.gh (69.0 KB)
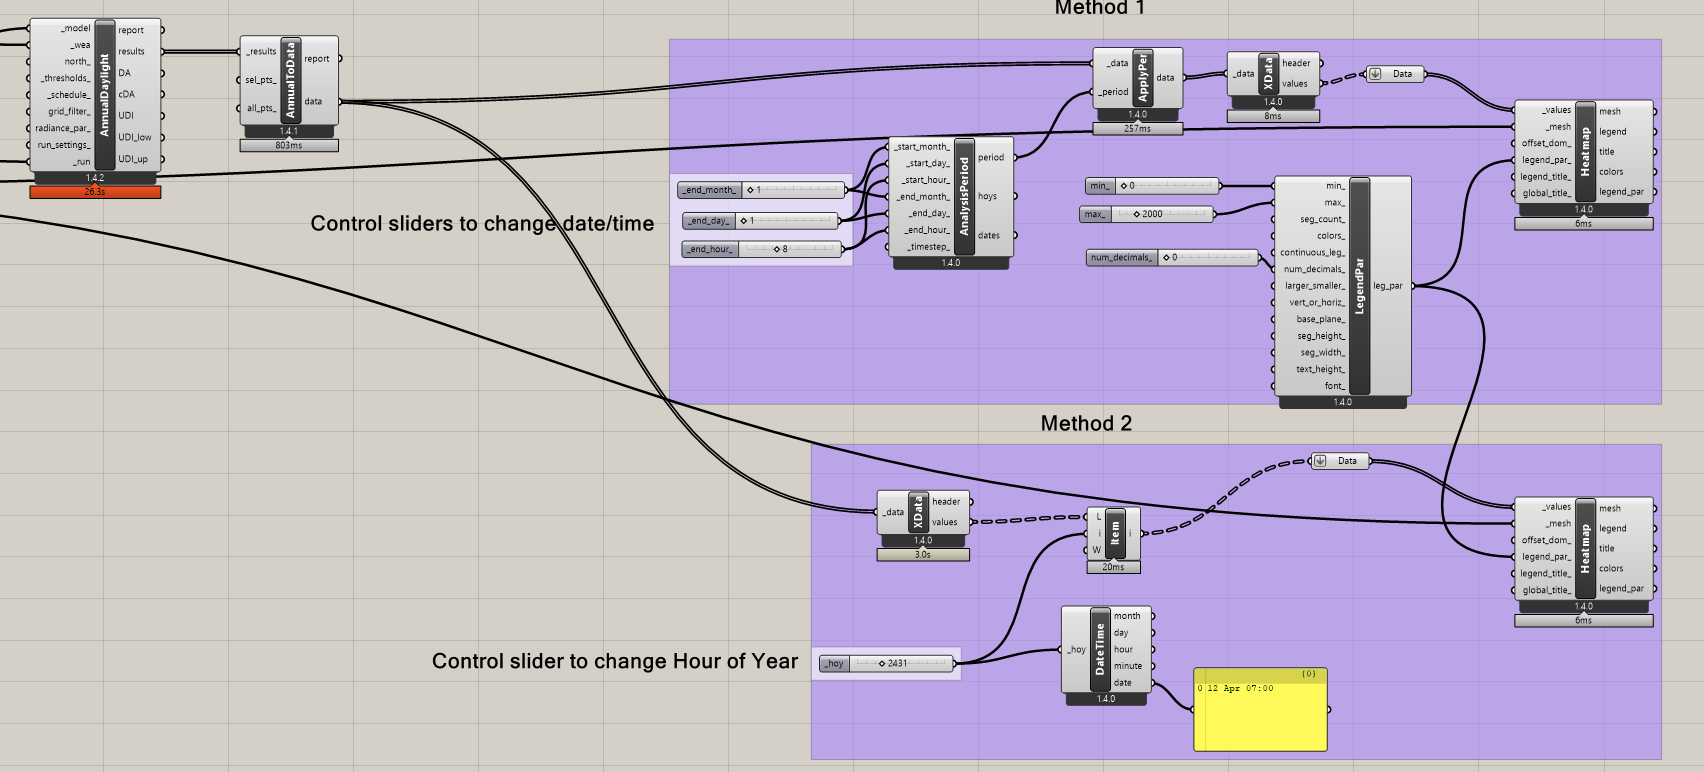
@charlie.brooker 's suggestions are good ones and they definitely get the job done, though there’s one other method that I could recommend that involves the fewest components and will usually be so fast that you can scroll through the illuminance in real time without having to import all of the illuminance results. You just have to make use of the _hoys_ input on the HB Annual Average Values component:
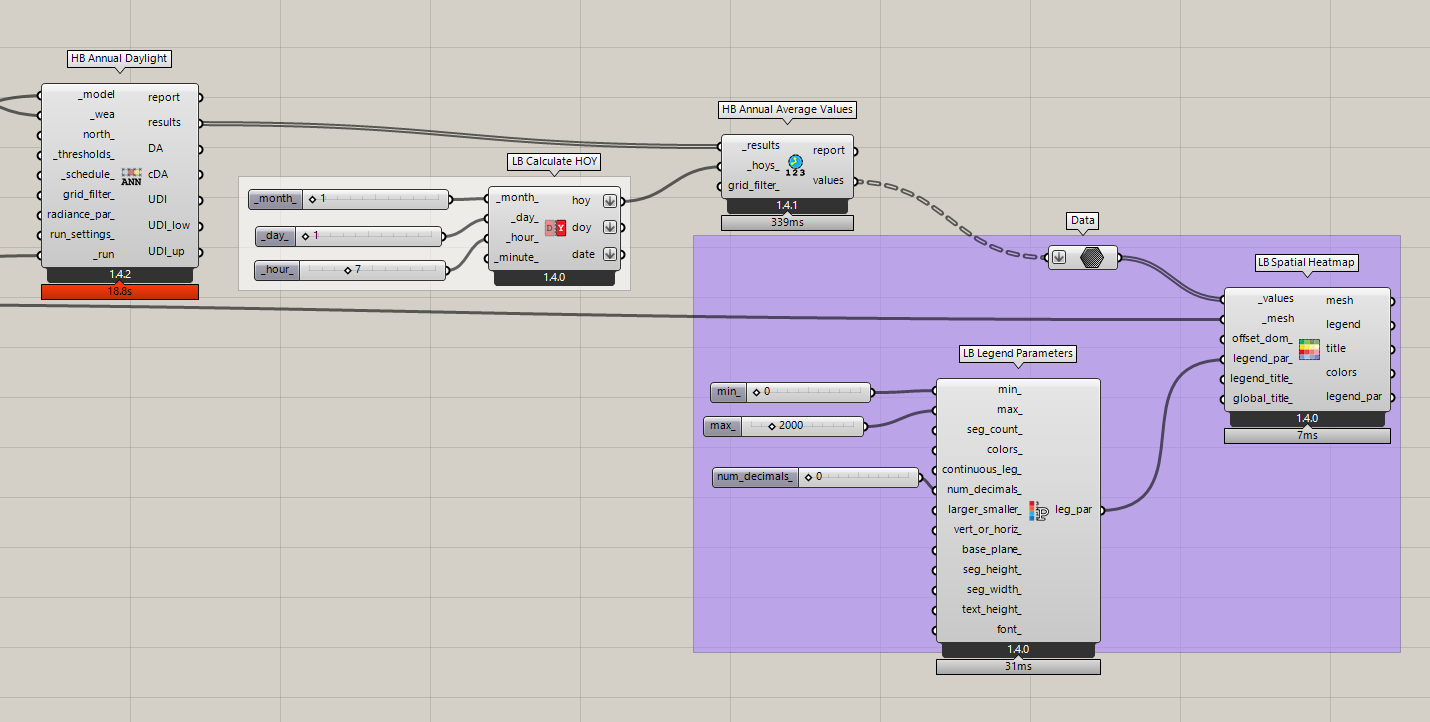
Daylight_HourlyResults_CWM.gh (60.5 KB)