Hi everyone!
I´m kinda new using the ladybug and grasshopper tools and I´m trying to analize a vsc at different segments, I did use a Colour Swatch with three different number segments, but it is complicated to have to visualize three different simulations everytime.
The easiest would be of course to use a gradient but when pluging in into the Par legend it pups up an error.
The three segments are betwen 0-12, 0-15 and 0 to 25.
please someone that can help me plug in the correct parameters!
Vicvsc test 1.gh (159.7 KB)
Hello!
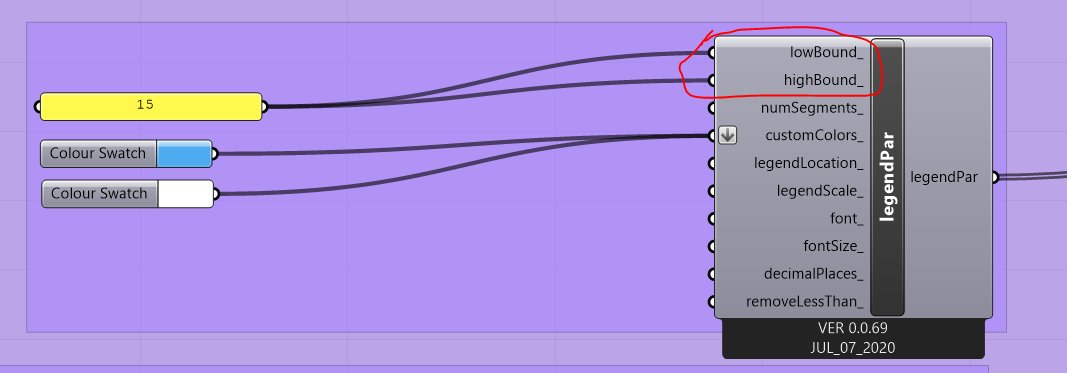
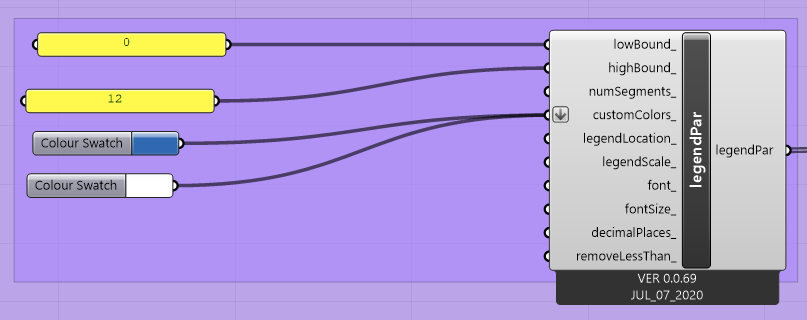
I don’t know if I entirely understand your problem/goal but you need to have your low bound and high bound be different values.
The other part of your question I don’t entirely understand. Are you trying to represent all three conditions separately but simultaneously? If so, you could have each recolor mesh be in a different location and have them all side by side represented in the rhino canvas rather than directly on top of your rhino geometry.
If you are trying to have all three in one graphic representation, there are a number of ways you could force the values into four buckets that are four different colors. A sloppy way I can think of is doing a greater than/less than splitting of the values into four buckets and then assigning them a new value ranging 0-4 and pushing that list back into the legend with the split colors as desired… I’m sure there is a more elegant way to do this.
1 Like