I have finally run my first 8760 simulation in Dragonfly. The workspace is about 20 structures of interest and lots of context shading. I have all this data now, but some of it is coming out in strange ways. My goal would be to 1) create a control that I can identify the room in the rhino view, visualize the basic plots for that room. 2) aggregate the 8760 across a single structure, identify that structure in the rhino view, visualize the plots for that structure 3) aggregate the 8760 across the entire workspace, visualize the plots.
I also want to make sure I am saving the data or that it is being preserved automatically.
For saving, I introduced this component to gh, but I am not certain what to expect from it, or if the way I set it up will not be overwritten without further safeguards.
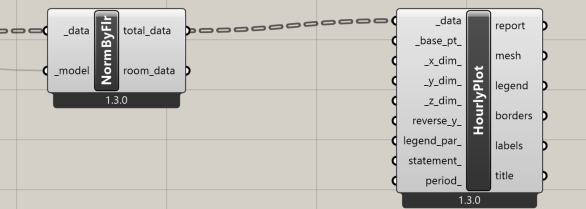
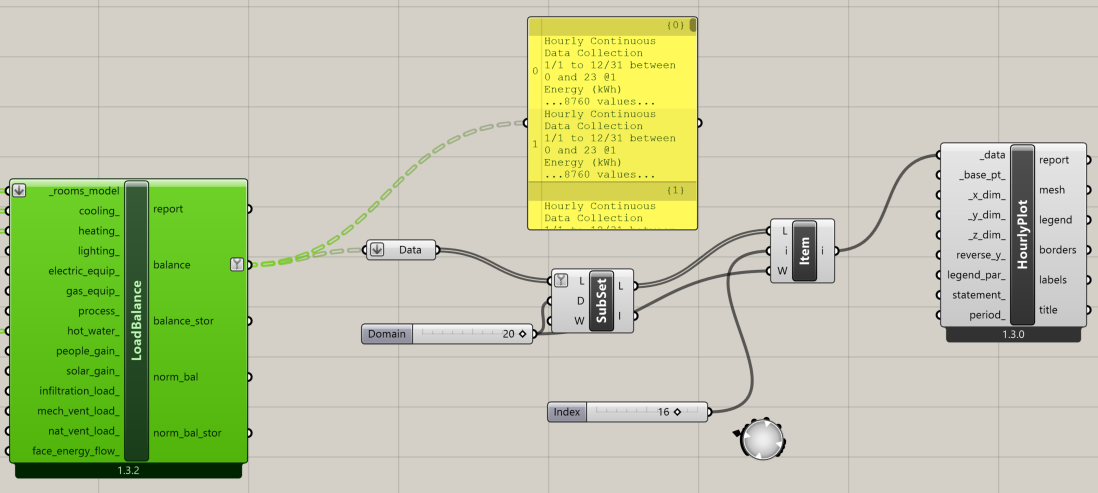
I am working this configuration to aggregate data:
When I input cooling from the LoadBalance component into this configuration, I am somehow getting overlap on the plot.
What is the best way to track these indexed, unlabeled lists of energy demands by room?
Finally, this is a bit different from what I can tell in the Honeybee tutorials, in that there is a lot more nesting of data in dictionaries and lists. What is the best way to approach the visualization problems and how do I put them to use?
As I said in earlier posts, I think you would really benefit from a tutorial on Grasshopper fundamentals THAT COVERS DATA TREES (aka. “lists of lists”). It seems that all of your questions about overlapping and indexing would be clear to you if you understood how these work (and how to flatten and graft them, etc).
Granted, I know data trees are not very intuitive and it took me a couple of years working in Grasshopper before I fully understood how they work. But, once you understand them, you’ll unlock a lot of the data management power of scripting in Grasshopper.
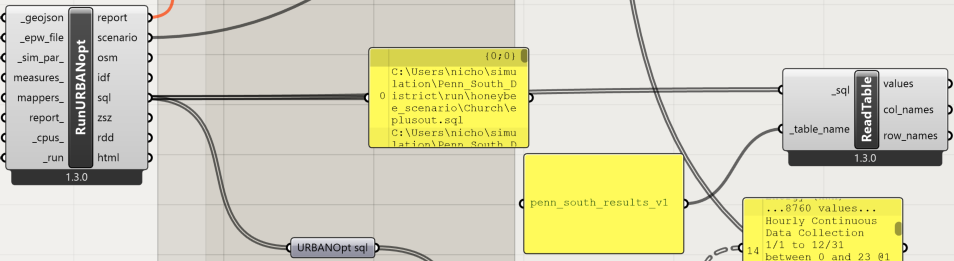
Thanks Chris. I am trying! Mostly I do not know how to retrieve the results on the GH interface after I shutdown and restart so it takes me several hours to resimulate and get to the point of even attempting to tinker with lists of lists.
You don’t necessarily need to resimulate to get the results… You can just read the result files from the previously simulated cases. I recommend to set the name and location of the cases so you can easily find and reload them.
-A.
I have got to return to this. I cannot find a decent tutorial on data trees that is not wasting a lot of time (I am at about 12 hours of watching). I really only want to know the peak load and the 8760 kWh heating and cooling demand for the structures I have. @AbrahamYezioro can you please take a look? I am sure this would take someone 5 minutes to build, that knew what they were looking for. My only other alternative here is to dig through .csv files and add them up, I guess.
@chris Are these values on the hourly simulation for the entire building annually, even if I use the multiplier for the URBANOpt?
Tried to check and simplify the case to just one building.
See attached. PennSouth_23Jan_AY.gh (1.4 MB)
The energy balance is missing something since the storage is taking a big chunk of it.
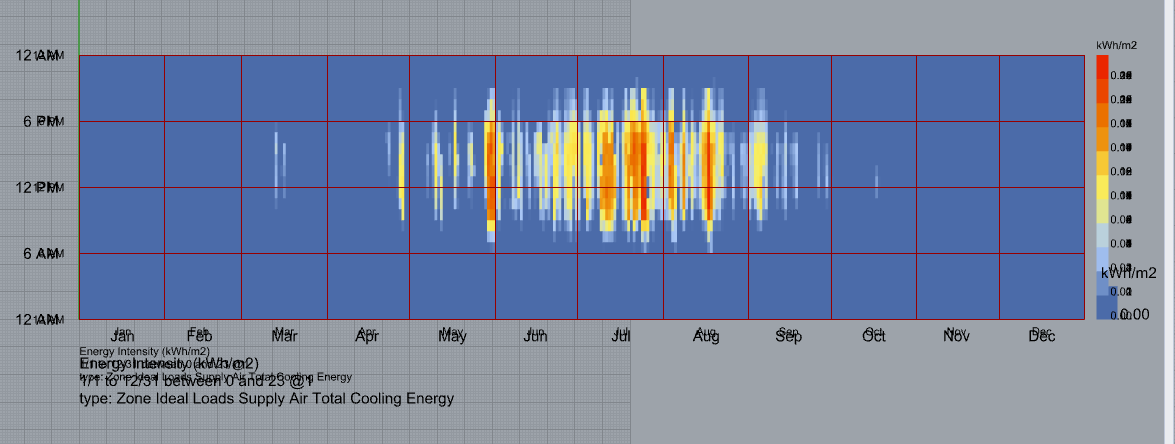
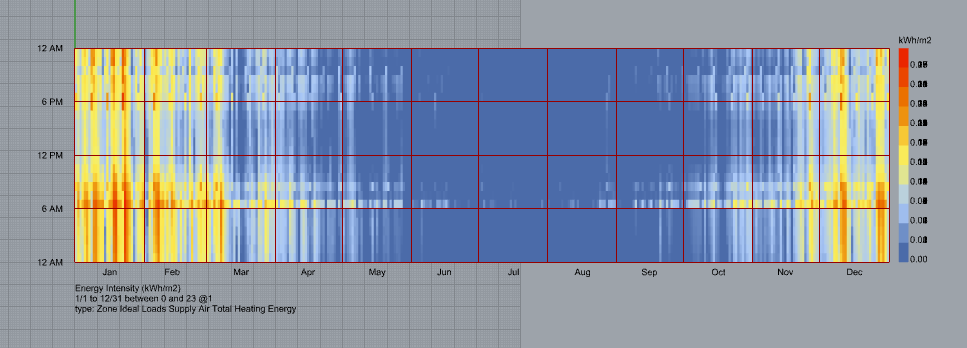
You can see the Heating/Cooling summary for the whole building (see all blue groups).
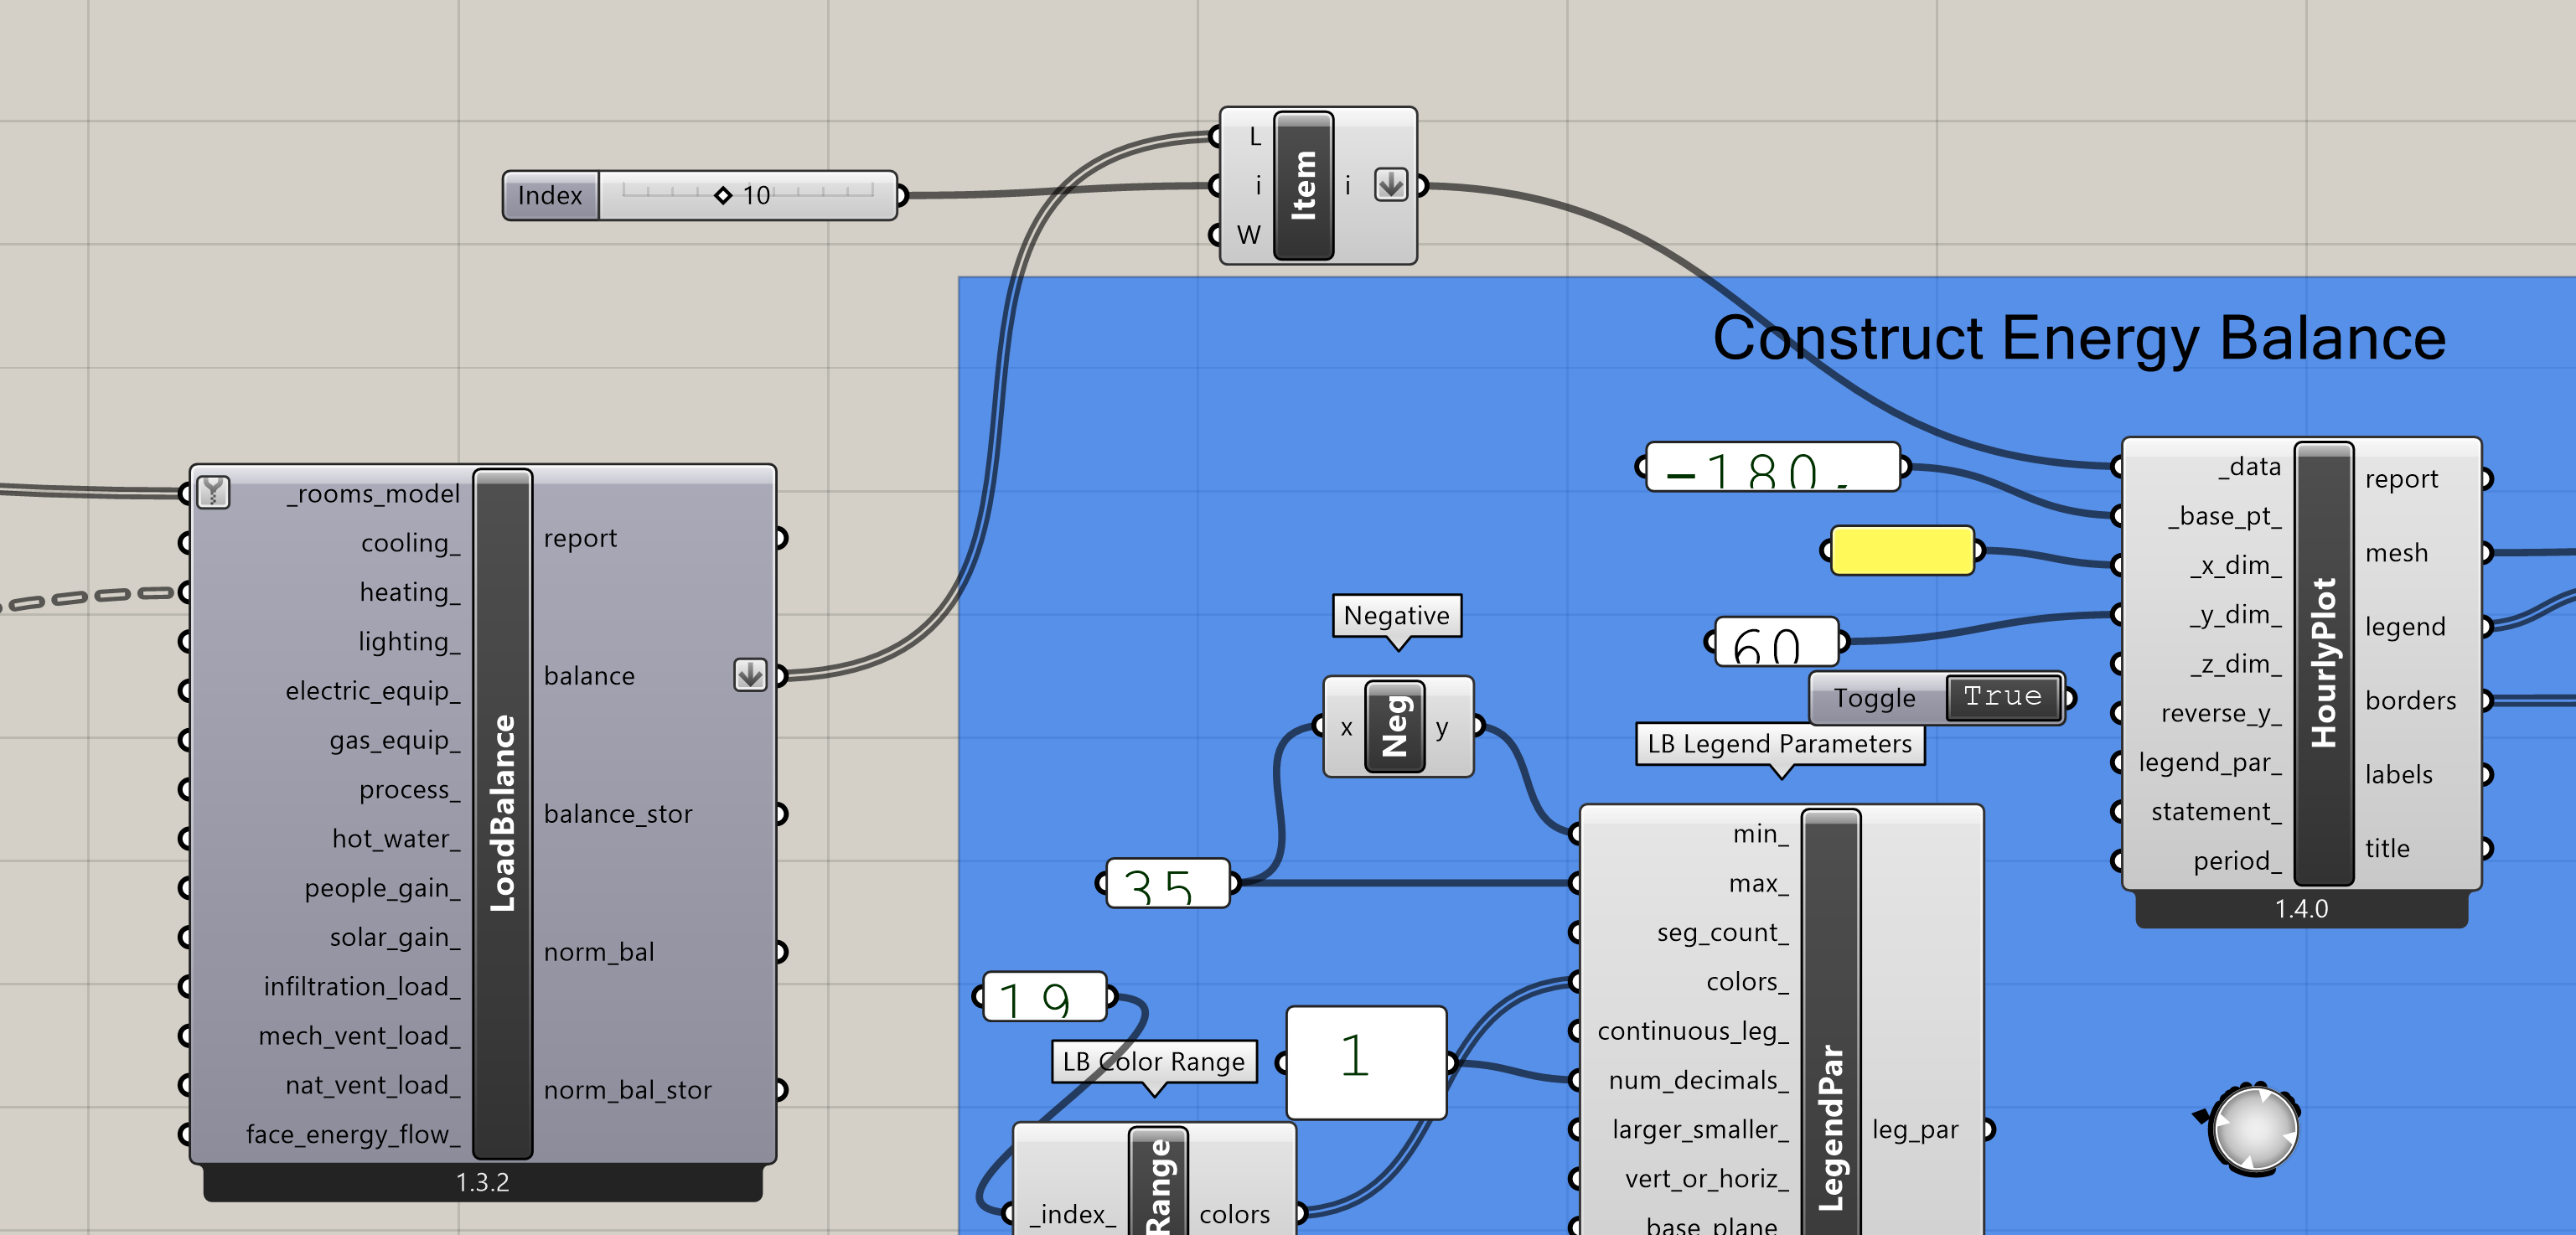
Thanks for trying to help on this @AbrahamYezioro. I do not want to implement the building selection until after the simulation is complete. So, I do not want to simulate a new building load with each click of a number slider connected to an index list. I switched it up a bit to index after the LoadBalance function.
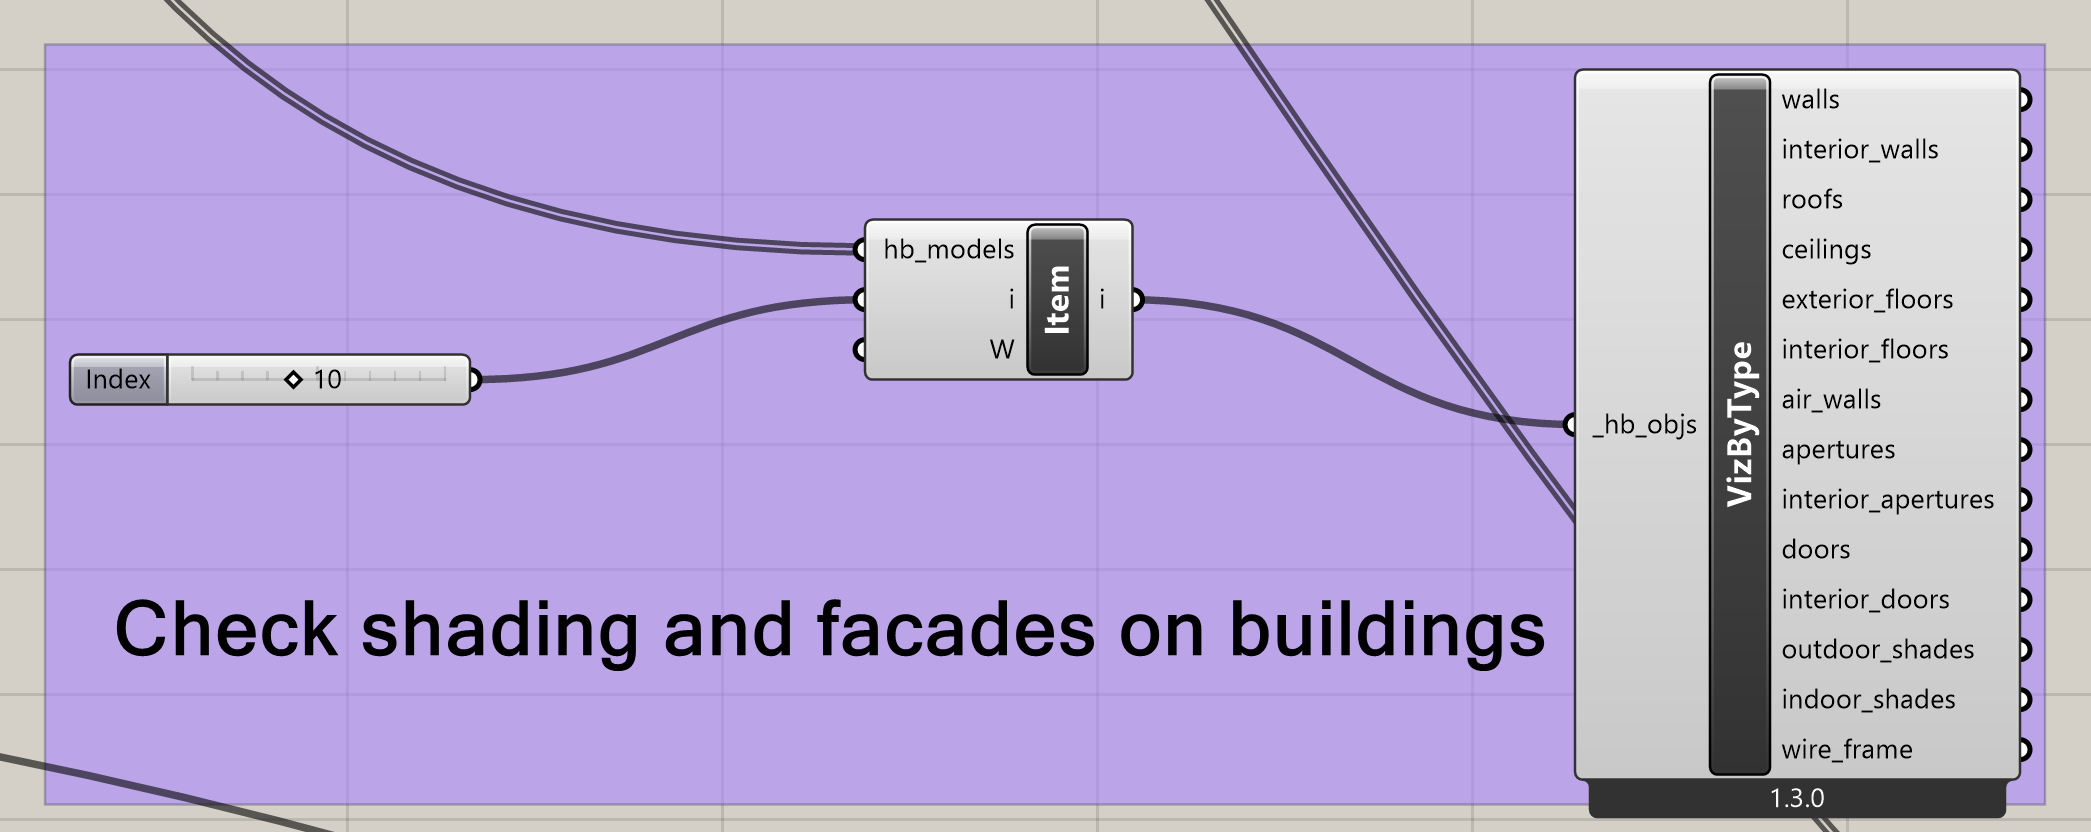
To understand what building I am looking at, I went back and set the index on the context shading view to the same value after LoadBalance. There is probably a much easier/cleaner way to do this, but at least I can put a name to a building now! I could not be happier.
Now I can reference a panel with the list of HB models to the index value from the load balance.
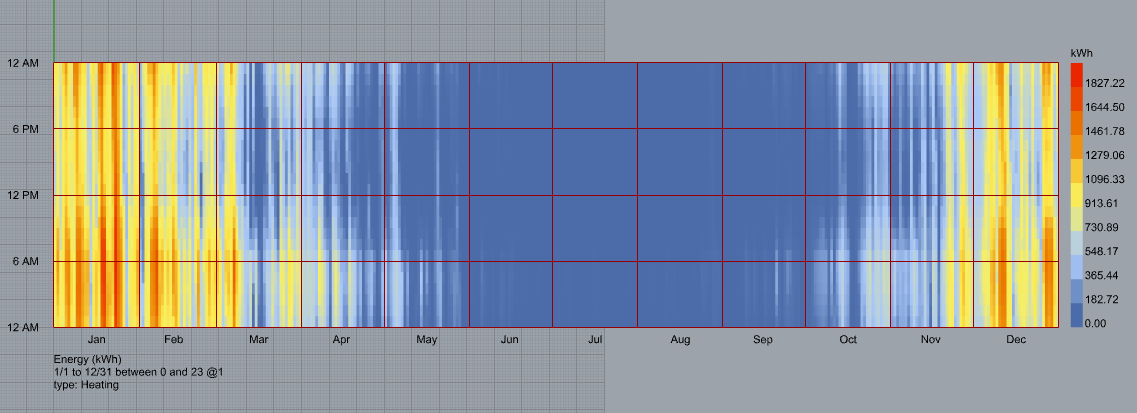
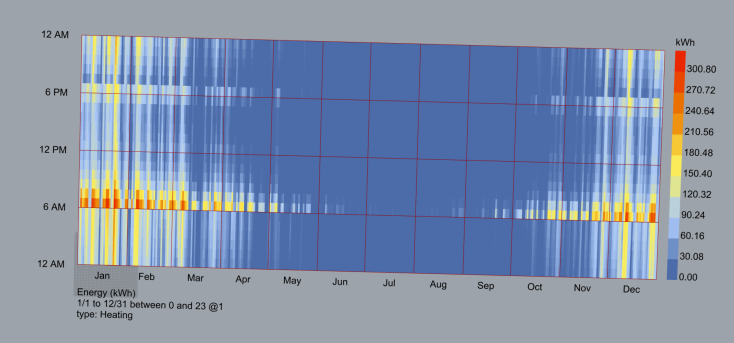
Any thoughts on visualizing simultaneous heating and cooling demand? When I connect heating and cooling to the load balance using the same index method it only seems to show me heating, so for now I am switching between the two.
Building 10 “Theatre”