Hi All,
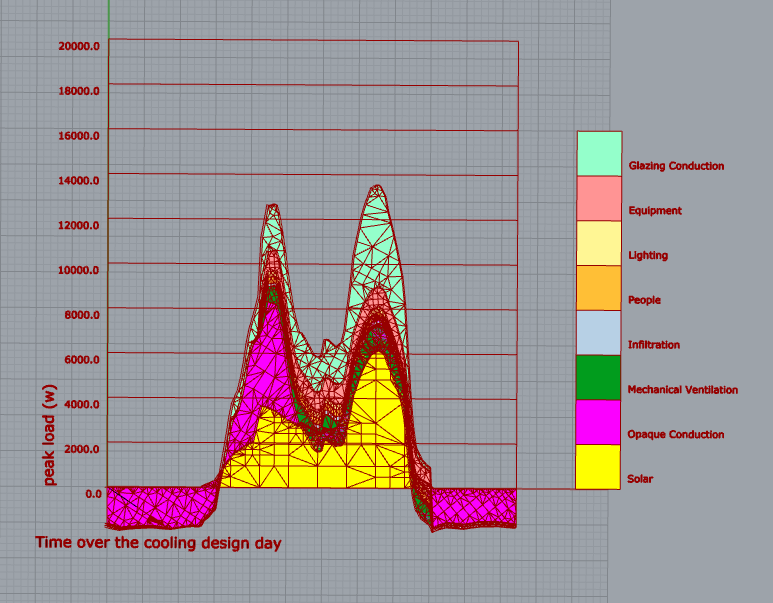
I’m trying to visualize peak load for HVAC sizing but the graph keeps going off tangent in Y-axis, and I’m not sure how to fix it.
I’ve attached the picture for your reference.
Thank you in advance for your help!
Hi All,
I’m trying to visualize peak load for HVAC sizing but the graph keeps going off tangent in Y-axis, and I’m not sure how to fix it.
I’ve attached the picture for your reference.
Thank you in advance for your help!
Hi, @yoshikawa, DId you solve this problem? I got the same situation like yours when I follow the steps shown in the example.
However, I have tried to use the material with no mass to do the peak load simulation, the result seems reasonable. But I have no idea whether the point is material thermal mass or not.
I think you should be able to use Legend Parameters to set the lower value of the Y-axis to be less than 0. Then all of the meshes should stay in the Y-axis.
If that doesn’t work, I know that the “LB Monthly Chart” in the new LBT plugin can definitely do this type of visualization with full control over the Y-Axis.
Hi chris, I think our problem may not be the Y-axis domain. For me, I just doublt why the cooling load from opaque surface can be lower than 0 in the cooling design day? The situation of my case is in the hot and humid area and I have checked the outside temperature is always higher thant the cooling set point.
This is definitely because the nighttime outdoor air temperature on the cooling design day is lower than the nighttime zone temperature on the cooling design day. Bear in mind that outdoor temperatures on cooling design days are not constant and follow the function here:
Also bear in mind that your zone setpoints might also not be constant over the cooling design day.
Thanks for your reply Chris, That’s make sense a lot. I think the temperature calculation method is part of the problem.
But I also check the material mass influence. The result shows the there are lots of energy flow differece when I set the wall material with the similar R-value with and without mass in two simulation cases (see the pic below). So I just doubt when Energyplus consider thermal mass influence in the surface energy flow calculation. I try to find the answer in the Bigladder documenet, but find nothing.
@bingjie ,
The Outdoor Dry Bulb Temperature in the upper left quadrant seems to be taken from the EPW file and not the design day parameters. You can use the “LB Import DDY” and the “LB Import Design Day” components in the new Ladybug LBT 1.1.0 plugin to see what the outdoor air temperature is for a given design day.