Hi,
I’ve encountered counter intuitive results from ladybug recently and wanted to ask if anyone had the similar issue and if I should consider this as a software issue.
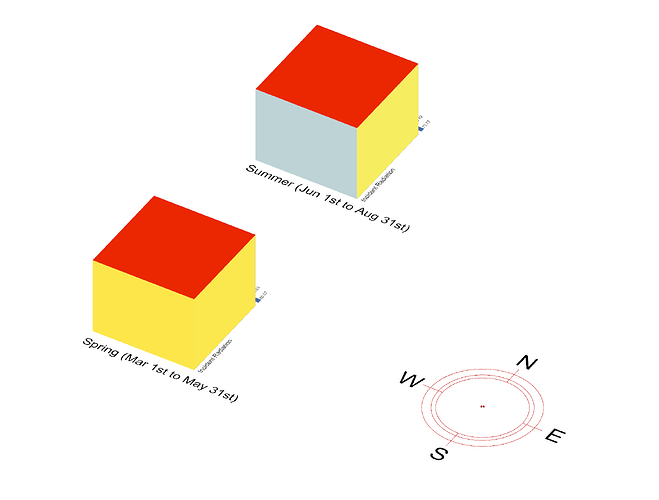
I was trying to compare the total radiation and peak radiation between spring(Mar 1st to May 31st) and summer(Jun 1st to Aug 31st). I’m using EPW of Pyeongtaek, South Korea.
The peak radiation during spring was 487.5 and the total radiation 854772.65.
However, the peak radiation during summer was calculated 440.3 and the total radiation 724220, which does not make sense to me.
Both the peak and total radiation, to my knowledge should be higher in summer.
What’s also weird about the summer radiation is that East face received more sunlight than the South.
Asking for help from anyone who experienced this before and the way to make realistic output.
