Thanks @chris for taking the time to explain your thoughts on the different conventions in LBT and EP. I can see the intent to align with a more intuitive 0–23 hour system, but I’m still stubbornly confused in practice.
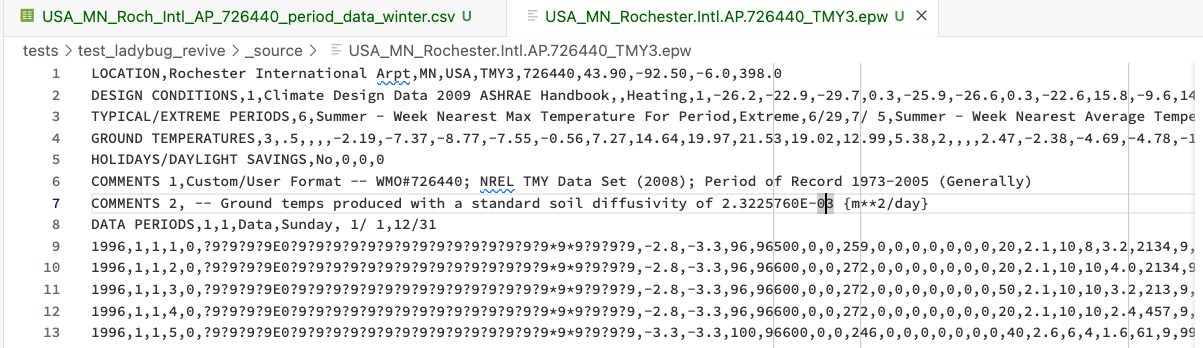
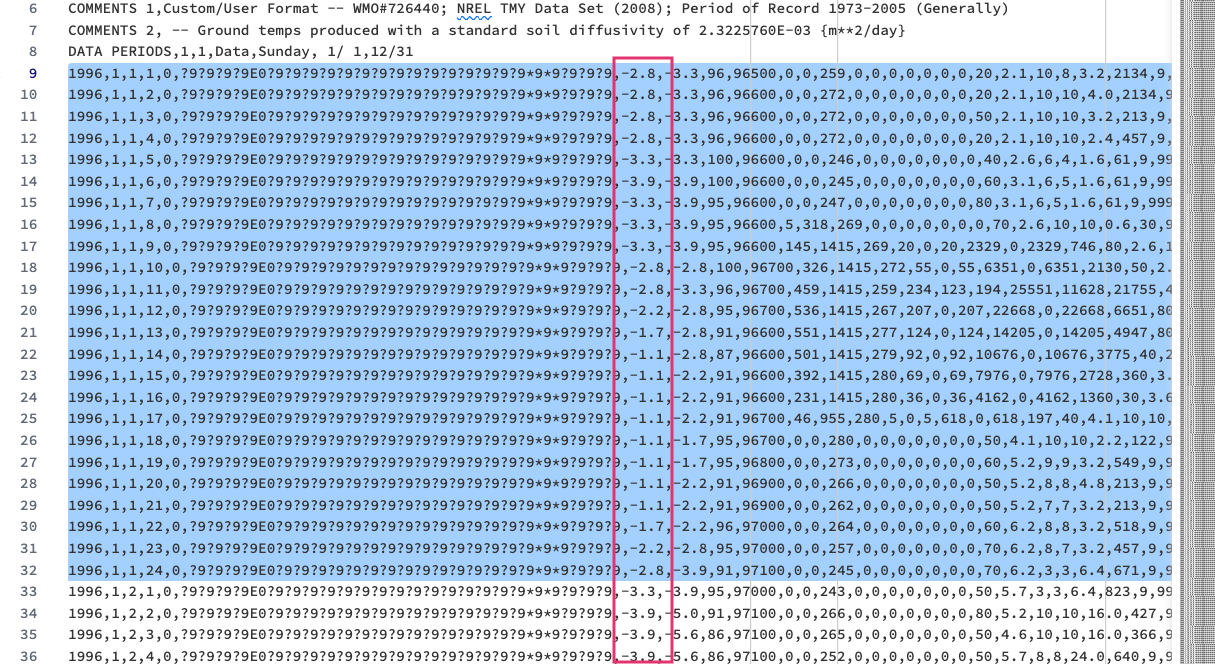
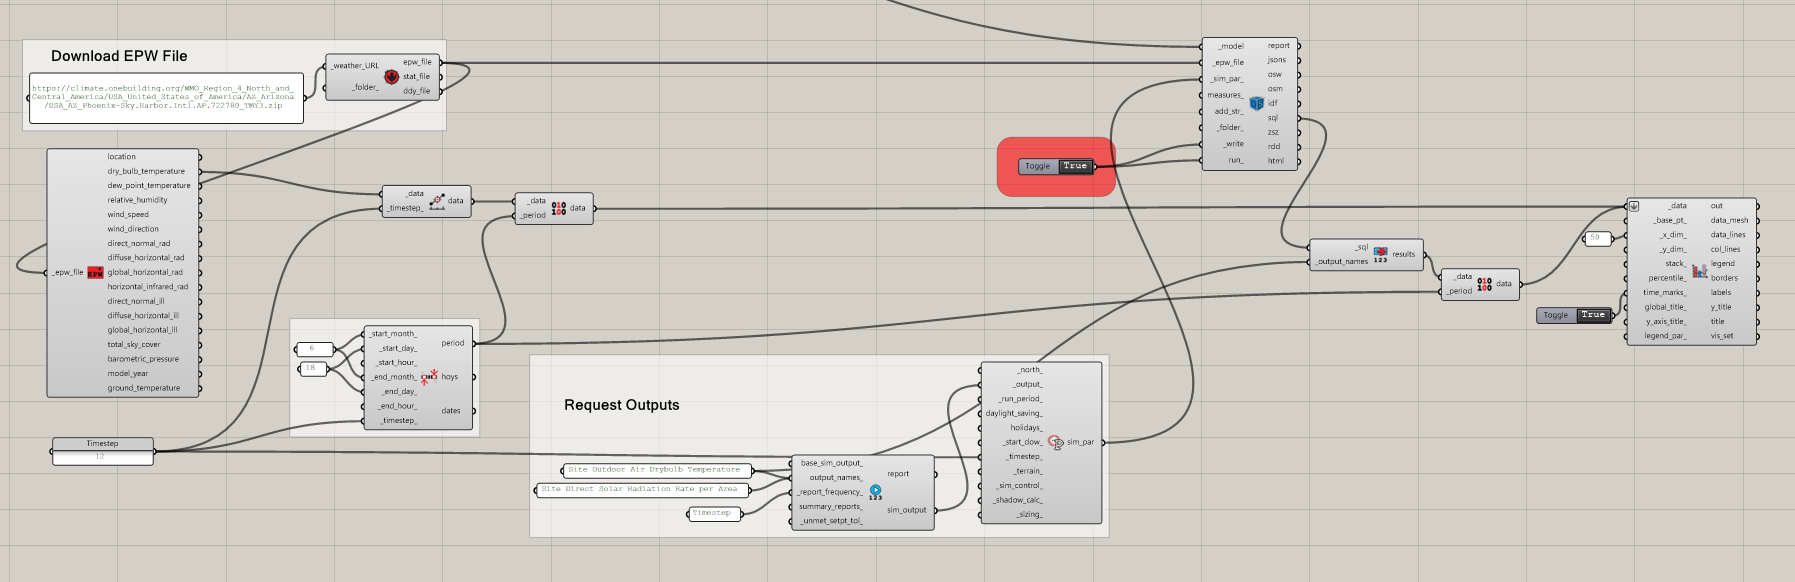
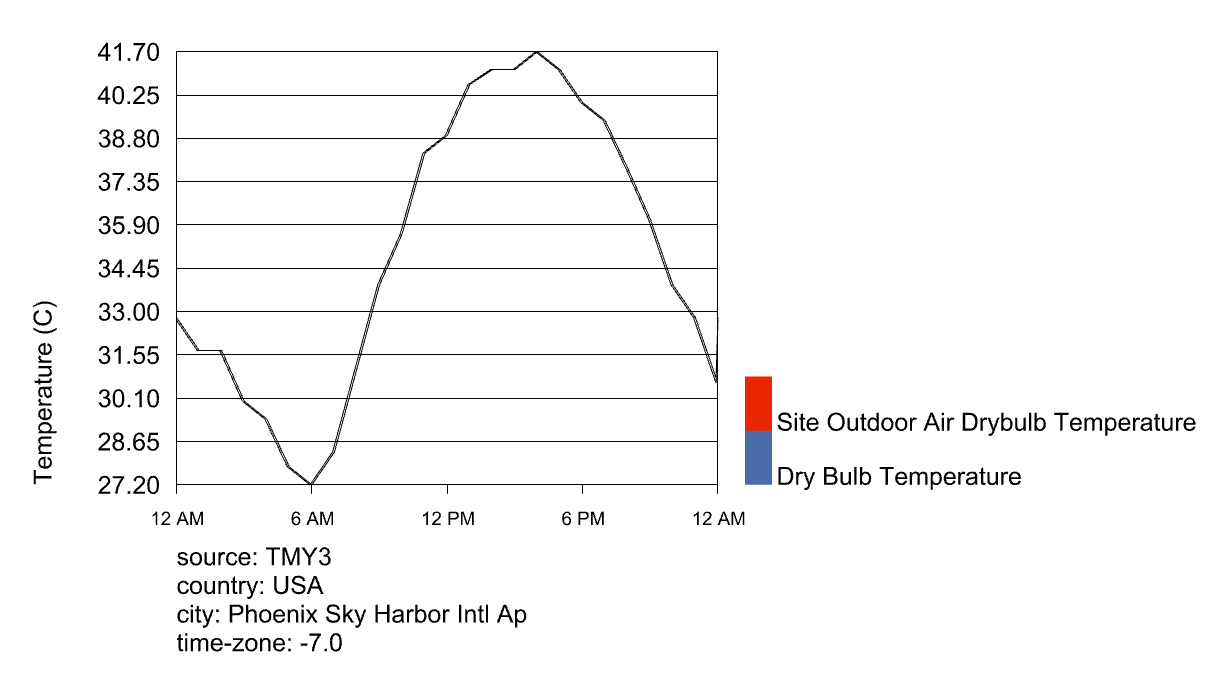
Just to give you an example, here I show the EP simulated indoor temperature from HB Read Custom Result (green line), the outdoor temperature from LB Import EPW (black dotted line, which comes out shifted), and the original outdoor temperature (black solid line), either from the EP output “Site Outdoor Air Drybulb Temperature” or from LB with a manual shift back.
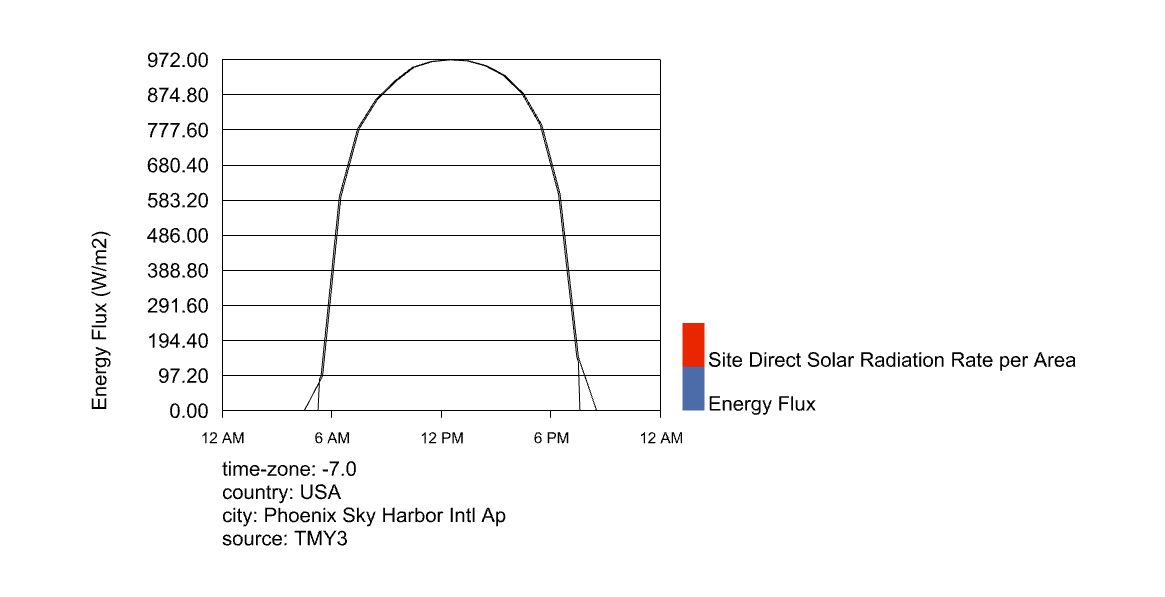
The indoor temperature always anticipates the LB outdoor temperature, which doesn’t make much physical sense. On the other hand, it aligns correctly when compared to the original weather data. Also, plotting the ventilation control as binary (windows closed when Tout>Tin), the transitions match only when using the original outdoor temperature. This mismatch doesn’t happen with solar radiation and solar control since LB import EPW doesn’t apply any time shift to the radiation data.
So I’m still unsure about this part:
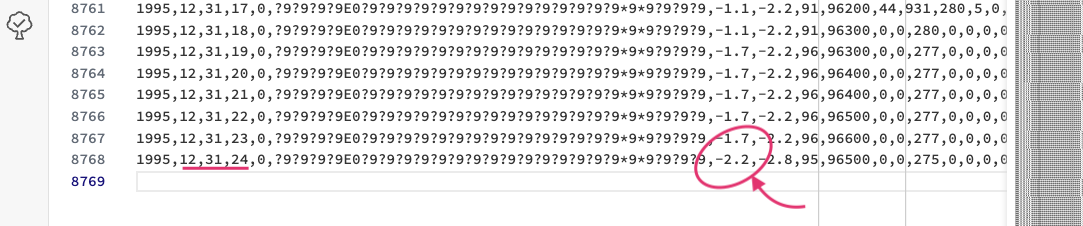
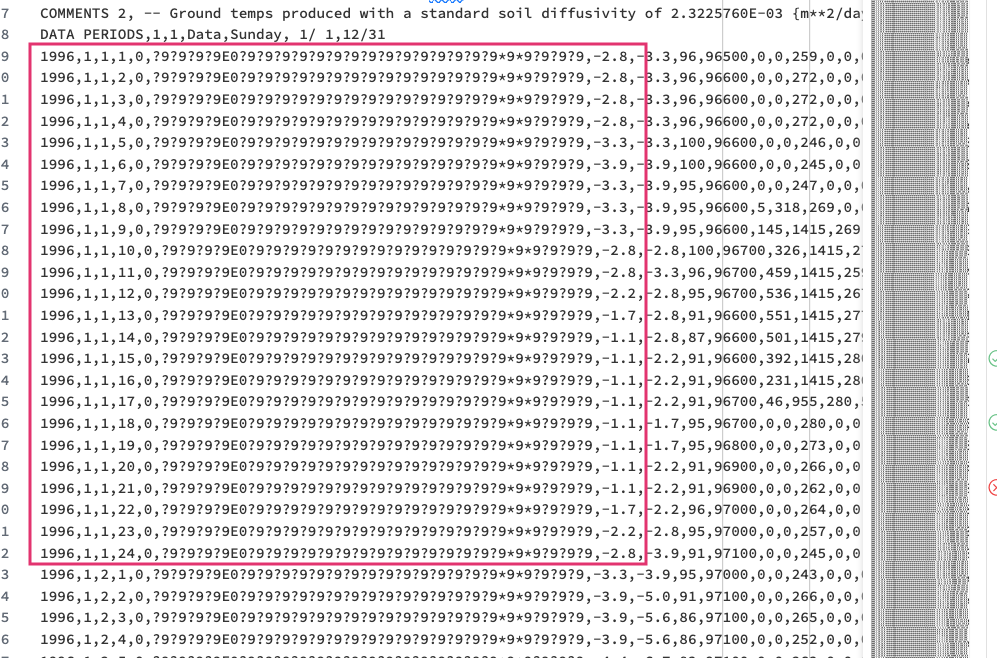
When we parse in EnergyPlus results, we don’t have to do the same shuffling because those results that you get for the first hour actually represent the transition of EPW conditions at 24:00 on Jan 1 to 1:00 of Jan 1. I know this because EnergyPlus warms up by re-running the conditions of the first day of the simulation until the transient simulation stabilizes. So it’s like E+ expects the hours to be shifted in its inputs but it produces outputs in a way that are closer to the datetime system that we all use.
From what I see, EP outputs continue using the same convention as its inputs, meaning that each timestamp represents what occurred during the previous hour, and this only makes sense when compared against the same convention in the input weather file.
So, Idk if the shift applied to weather data works better for other LBT uses, but I find it unreliable when comparing them with EP outputs.
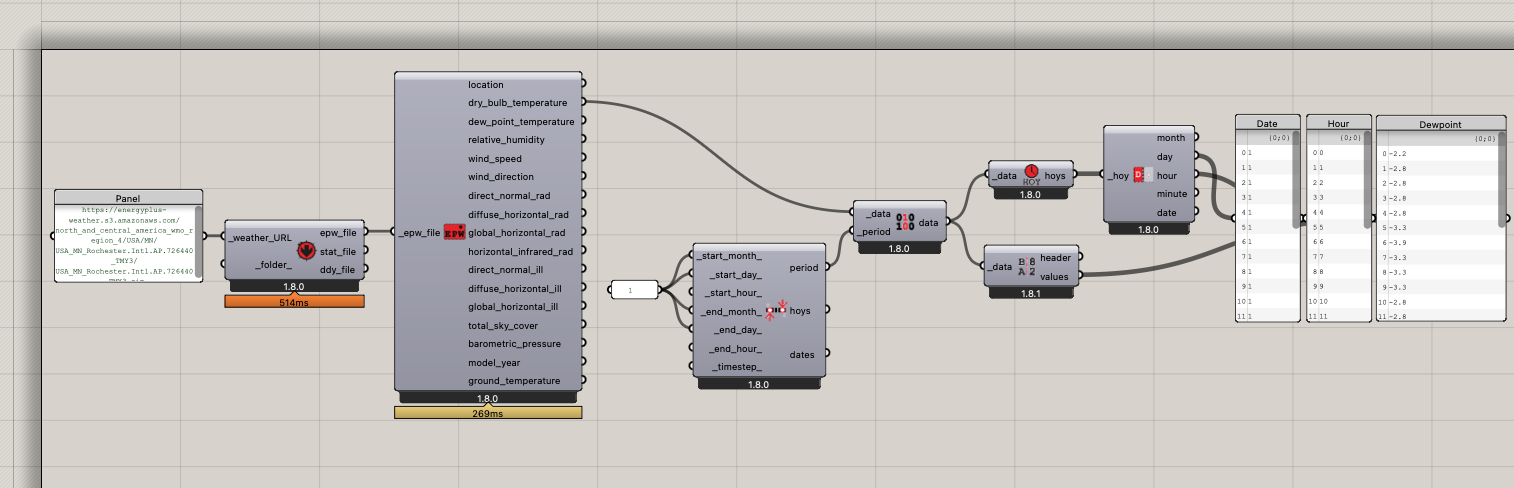
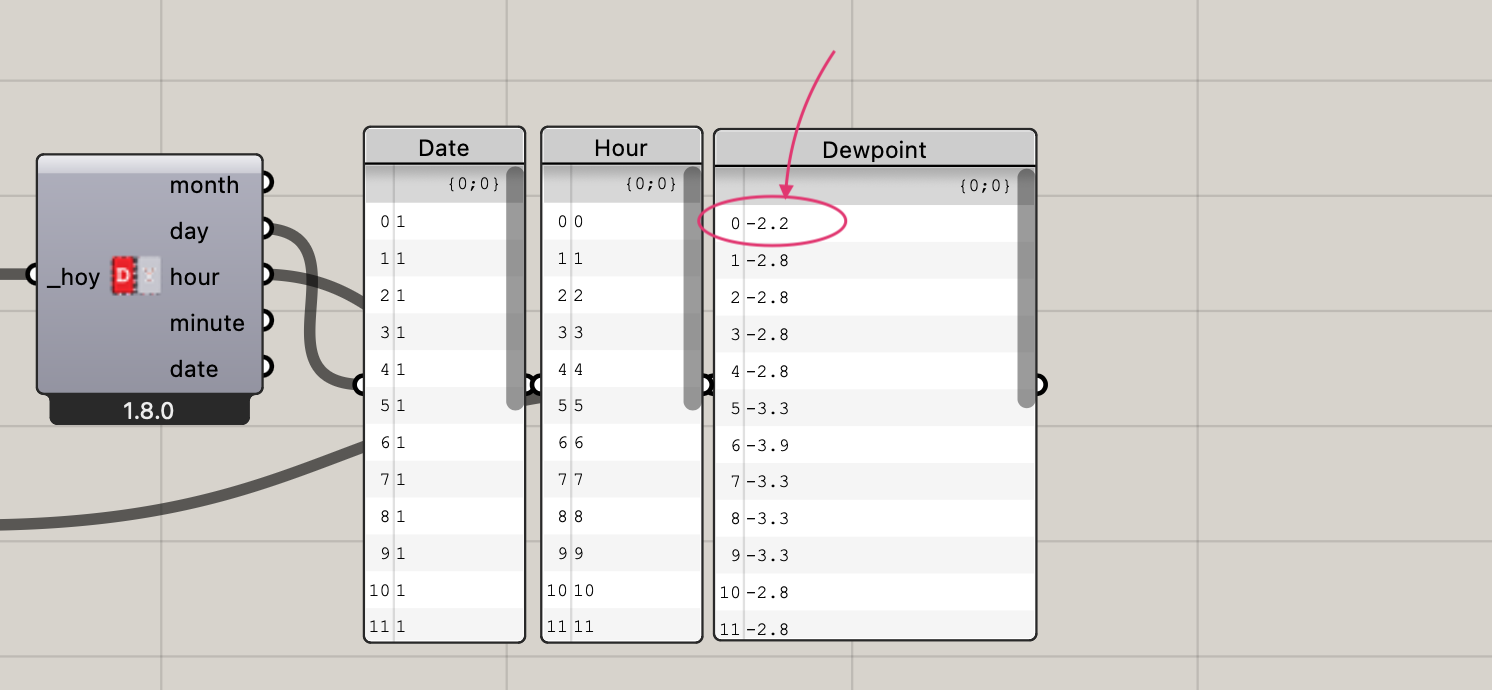
Another thing that confuses me is when I use the Analysis Period component to analyse the weather of a single day for example: selecting 0 to 23 ends up returning data that were meant to represent from 23 of the previous day to 23:00 of the selected day.
I’ve tried to make a sketch of how I understand the conventions of EP/EPW and LBT.
In my view, applying a 1-hour shift to some (or even all) datasets doesn’t feel very straightforward. So, until the EP world adopts the 0–23 convention, maybe the easiest solution is for LBT to define its own internal logic, for example by stating that each timestamp represents the hour that follows (LBT* in the graph). This would at least ensure coherence within the LBT environment.
I’m proposing this to open a discussion for a solution, and not just to raise a problem (which I still believe exists). Personally, I mostly mind about maintaining consistency in the way data are handled within LBT, and having more clarity when data is automatically postprocessed (maybe with a flag or an option to choose whether to shift them or not).
I hope the way I’ve explained things makes sense and I’d really appreciate any clarification if I’ve missed something