Hi everyone,
I’m trying to produce the wind rose diagram from the weather file from one of our weather data in Taiwan.
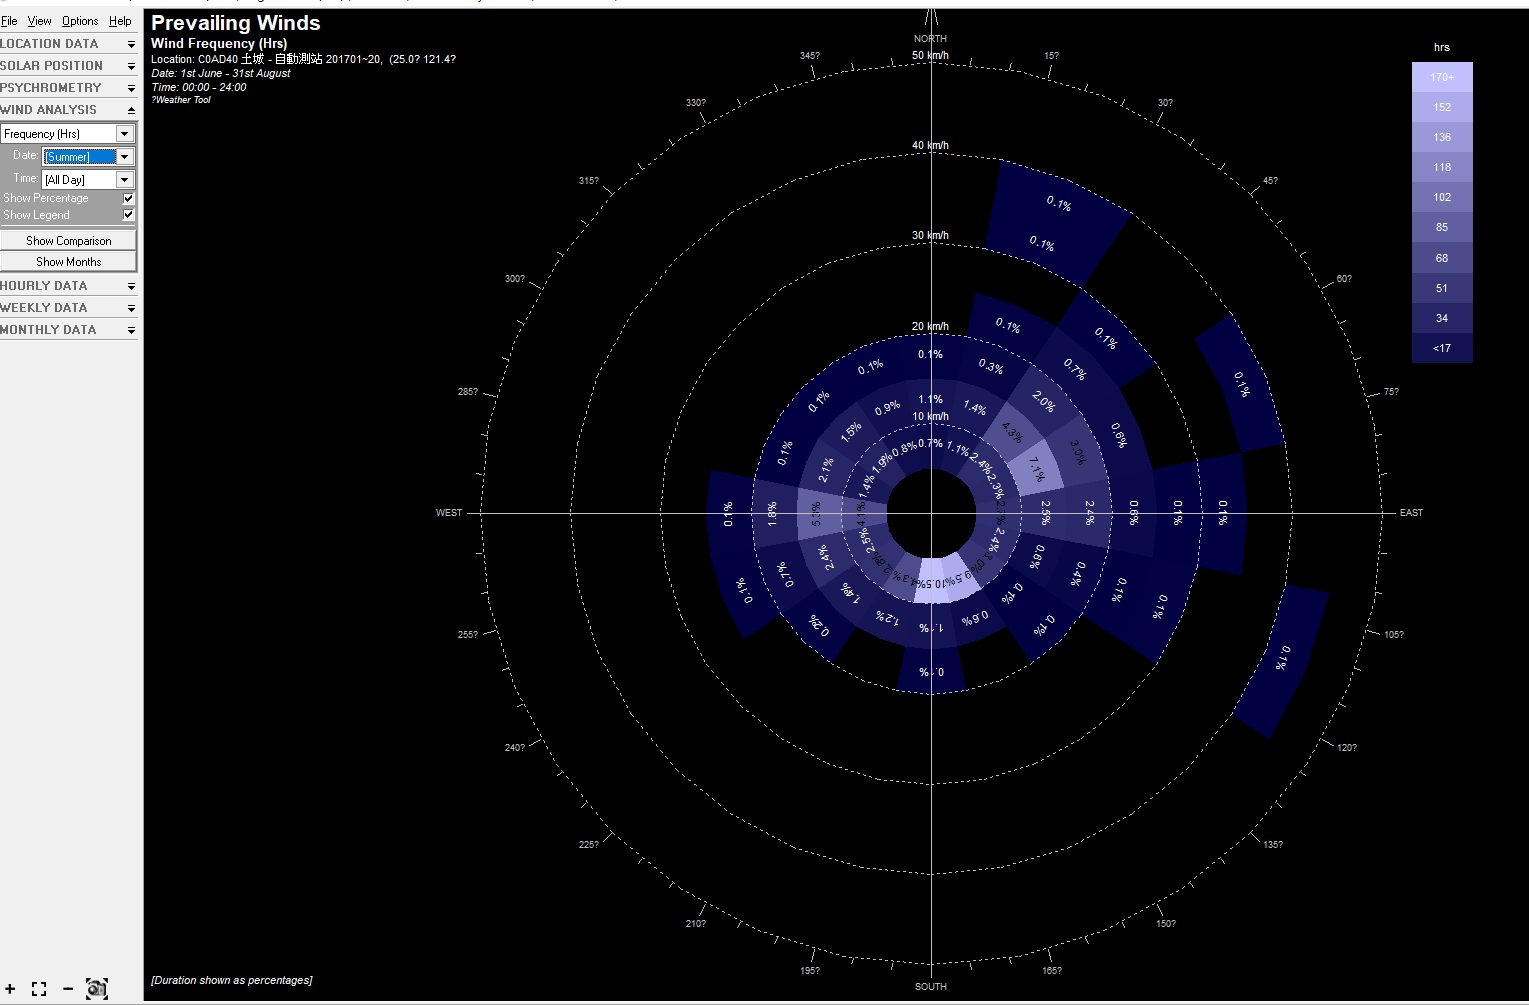
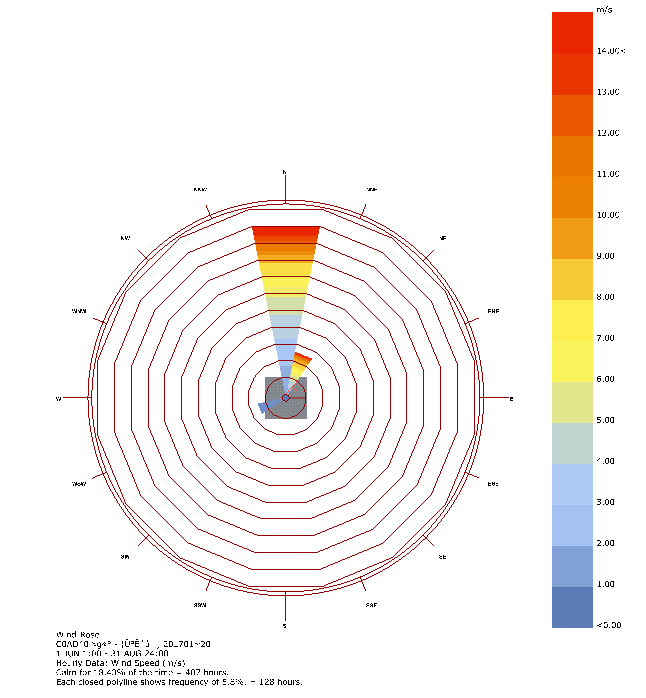
The result is confusing me because the prevailing wind direction is very different from ladybug and Ecotect.
The prevailing wind from Ecotect shows that is mostly South wind in summer, But from ladybug the wind is mainly from the North. Why is that?
Hello,
(https://drive.google.com/drive/folders/10pxk7o3akKn-dMFTdGV0Q-oiiBMs2jY7?usp=sharing)
The epw is on the drive, I was thinking is it because of the file is not TMY3 weather file?
The weather is the whole year of 2017 data, and it was originally .wea file which I converted into .epw using Ecotect. Would it effect the result?
Cause I used the online epw viewer and it can’t draw a wind rose diagram.
Thank you very much.
@endison8
The epw file you shared has all wind directions from 0-255, which makes me think this is not converted correctly from wea.
if you have originally recorded data, you can just import wind speed and wind direction directly to Grasshopper, and then use LB to visualize it.
Sorry I know it’s been a long time:
“if you have originally recorded data, you can just import wind speed and wind direction directly to Grasshopper, and then use LB to visualize it.”
I’m sorry I’m quite new to the ladybug, how am I suppose to import the recorded data to grasshopper?
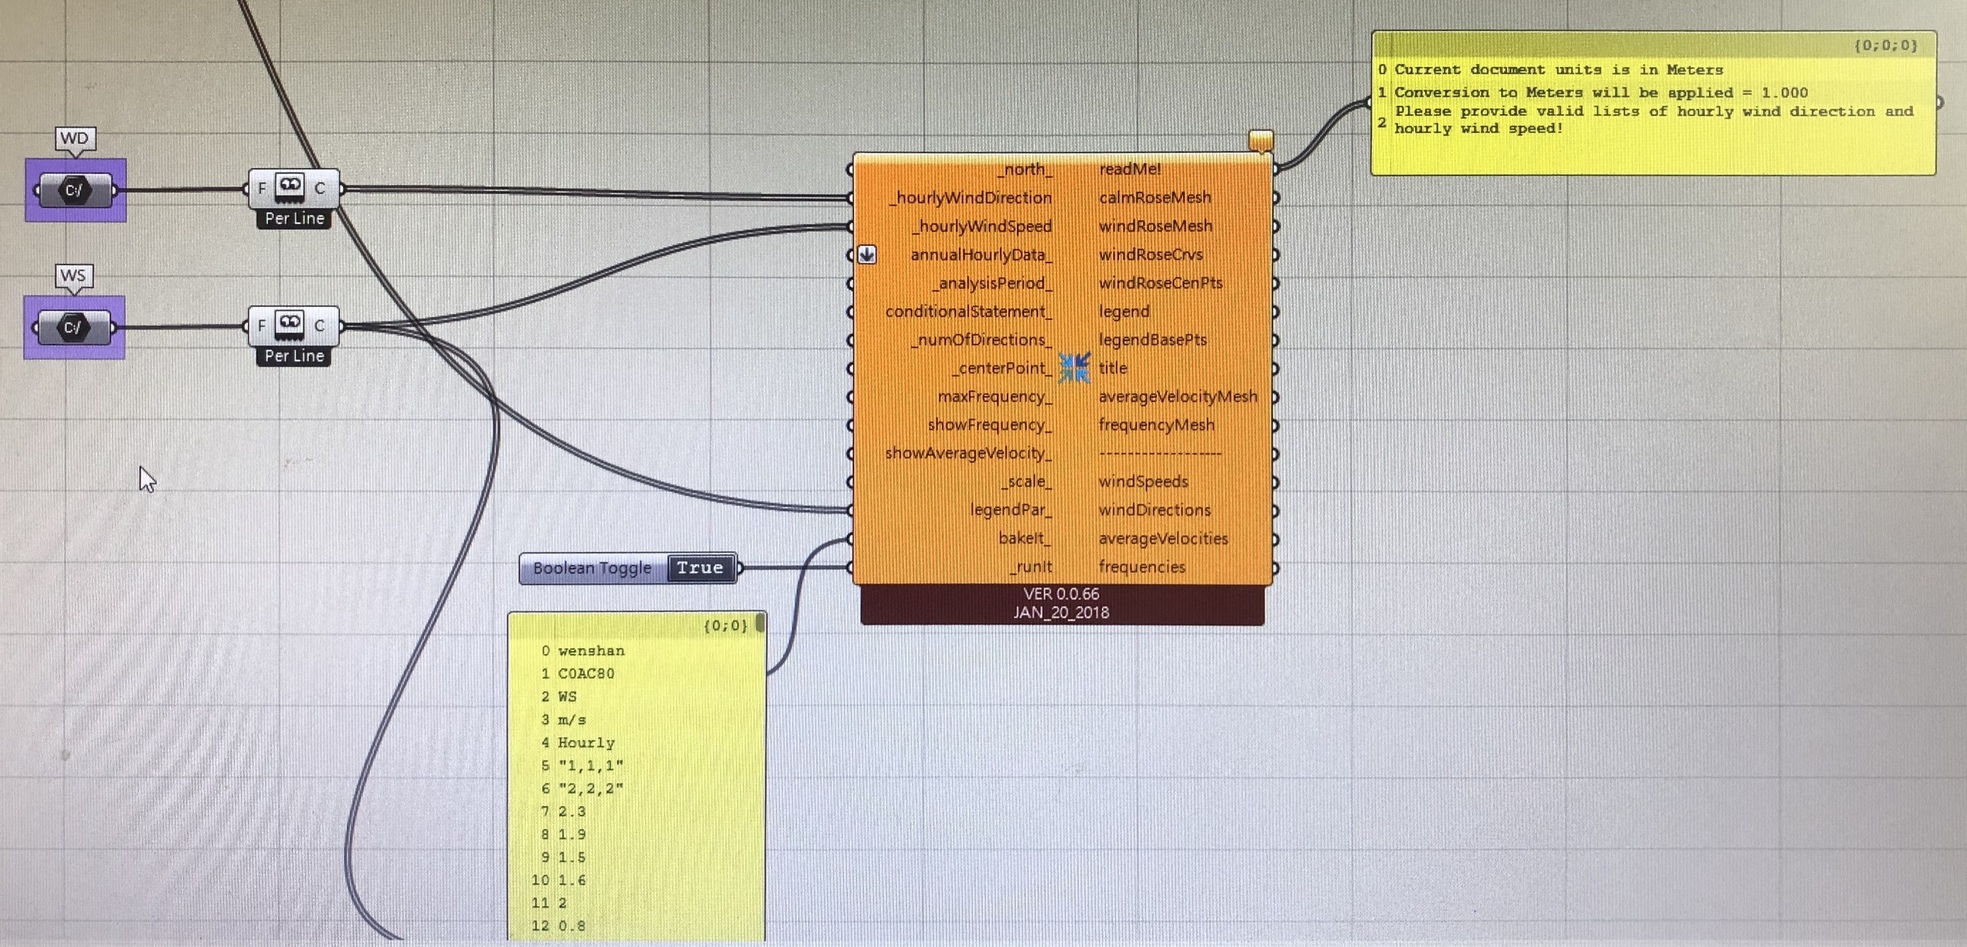
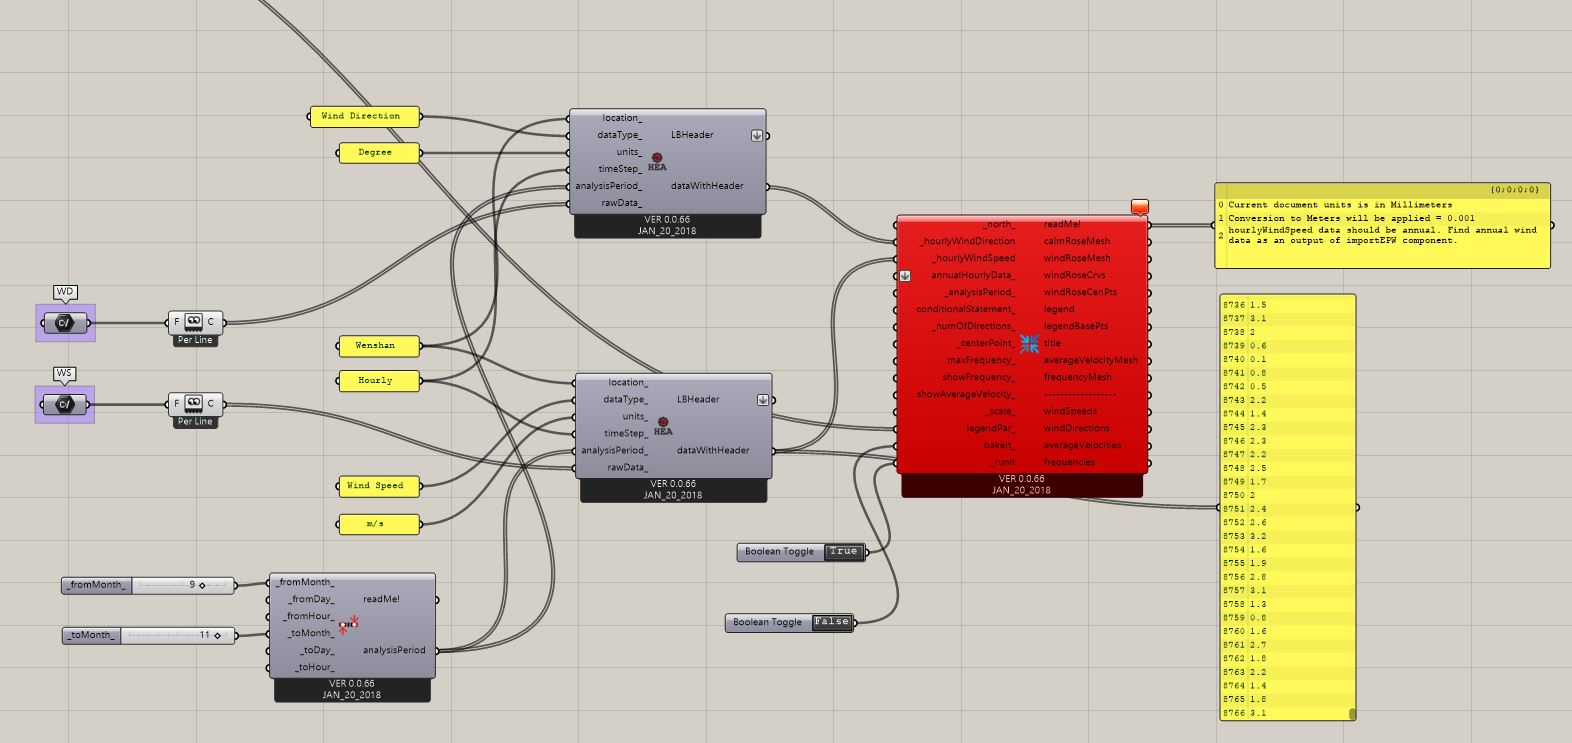
Please use Ladybug_Create header component to create a inputs for windspeed and winddirection. This component will simply help you format your data in the way Ladybug understands.
Hi guys,
any suggestions?
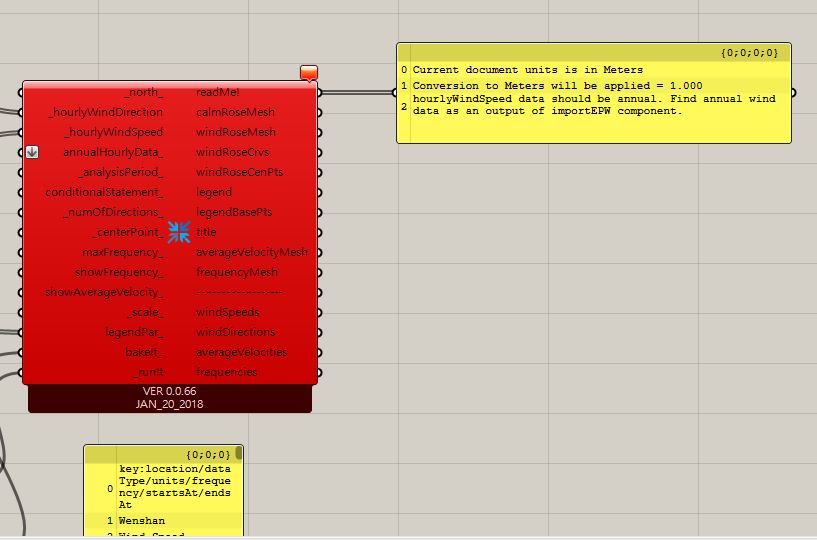
I realized the picture I uploaded said the unit is millimeters but even though I changed the unit still show the same error though…
You need 8760 values in a list. However, in the lists you are trying to use there are no values at the following indices. Please fix that and it should work
Hi,
Thank you for the suggestion, actually I did realised the issue and fixed the data, there is no error showing the whole year wind rose after fixing the data.
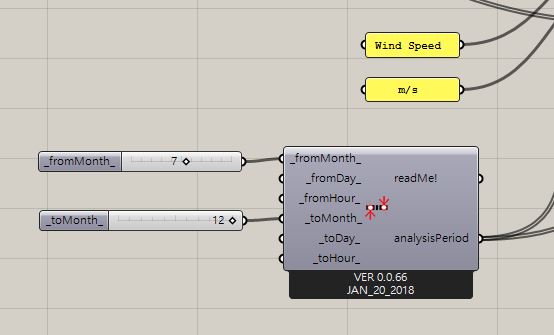
However, one of the reason that still cause the error was that I kept the time period from Sep to Dec.
Am I able still use the analysis period component for different season? If not, how can I create different season wind rose?
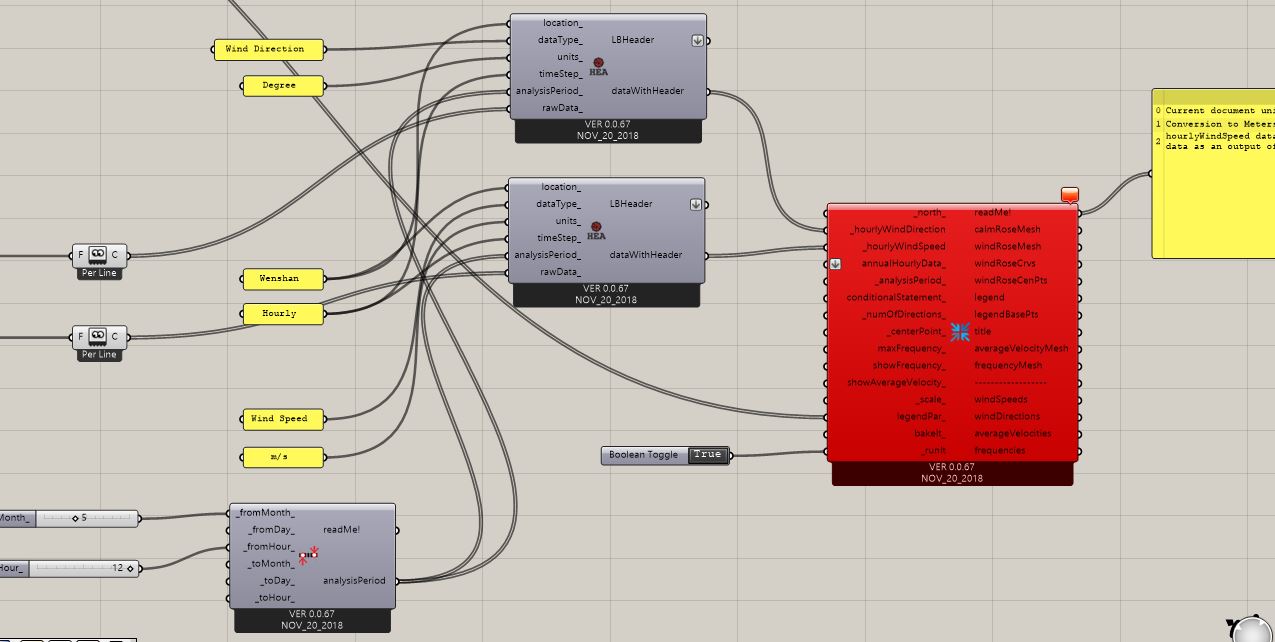
Here is the corrected data: Wind_ImportRawData.rar (511.9 KB)
hi, did yuoo solve the issue ?
i am facing the same issue to visualize the data from excell as wind rose i have 8760 value but it dosen not accept my list as valid data