Wind Simulation in Butterfly Number Range and Colour Error

Hi, I was following the Butterfly Wind Simulation on Butterfly CFD- A Simple Wind Tunnel Analysis With Grasshopper - YouTube

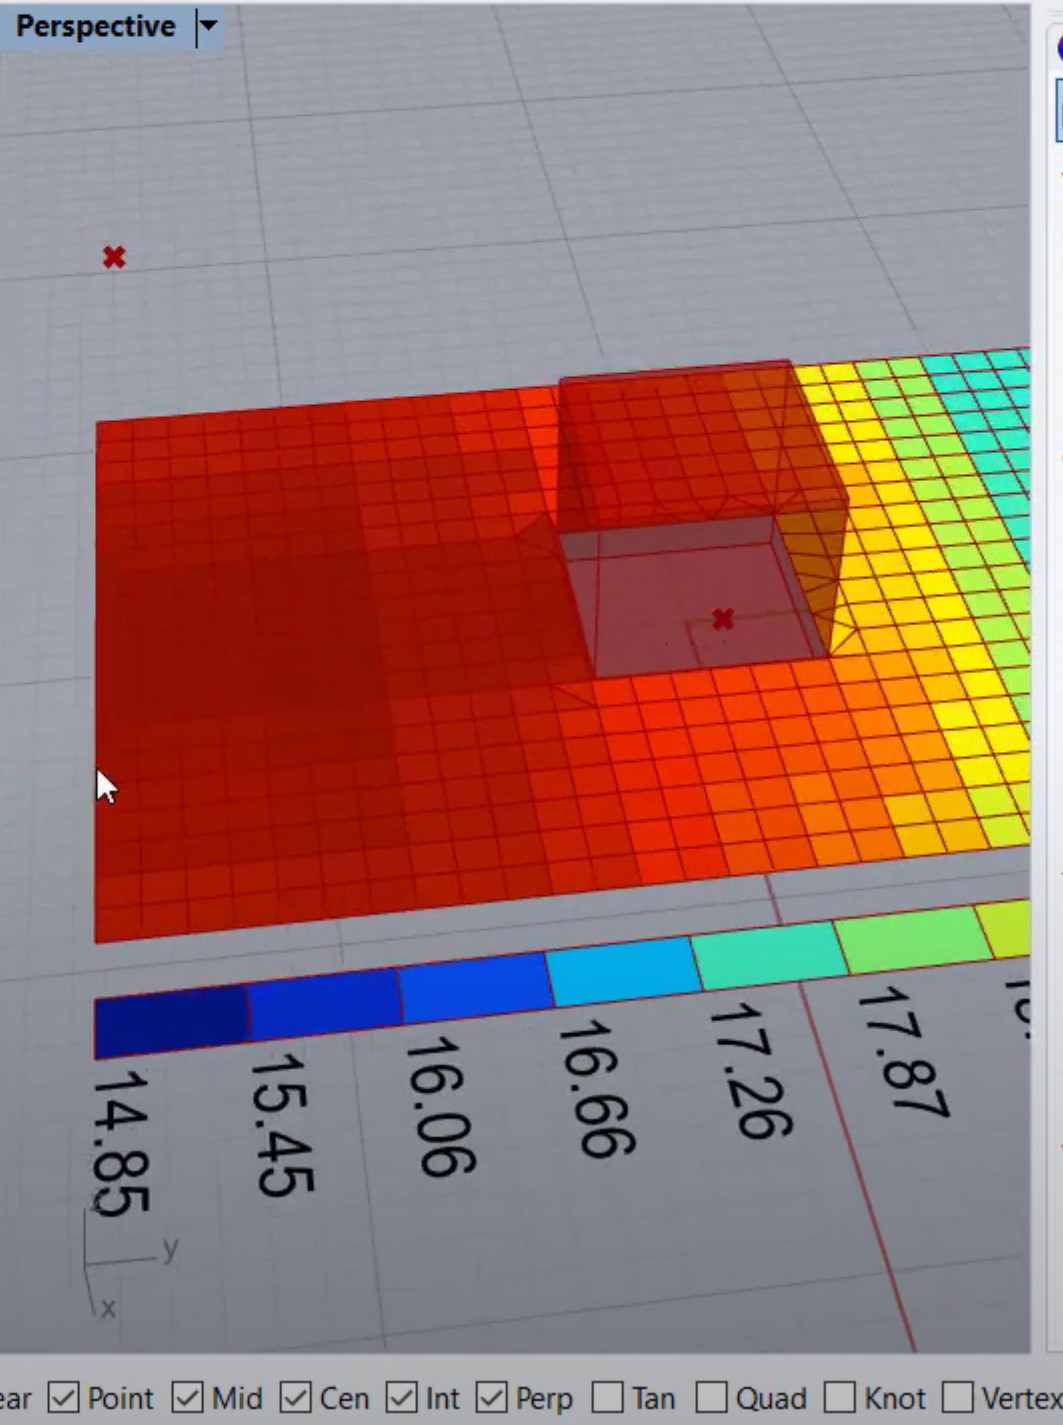
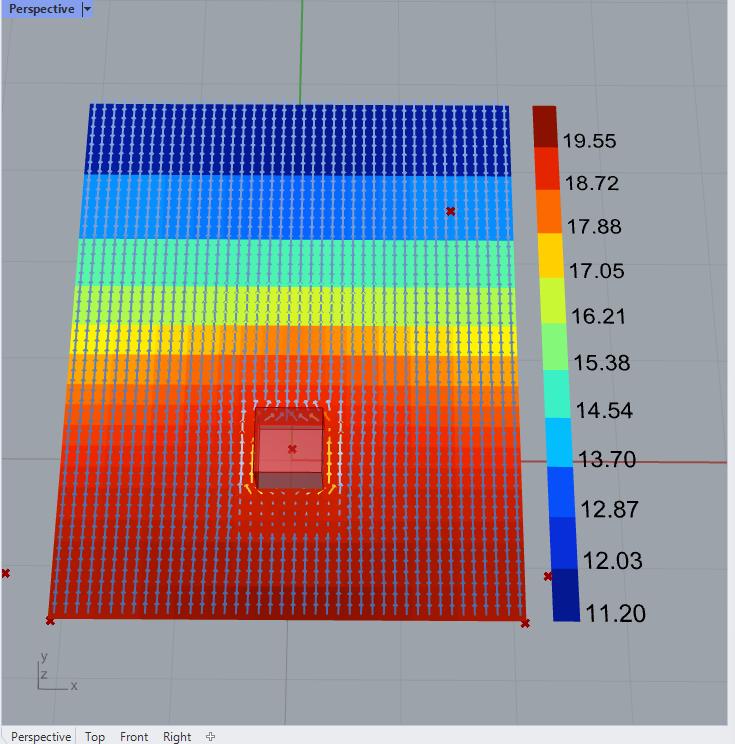
I am able to run the script without any errors popping up. However, my end results are different in terms of the final colour range and values. Attached below are my values in converse to the tutorial on youtube.

May I check which is the component to adjust the values?

1st Image: From Youtube Tutorial (Correct Results)

Results I get

2nd Image: Results I get (Wrong and showing negative values)

3rd Image: Results I get (Wrong and showing just blue colour, it is showing an enormous negative value)

Please ignore red outer parts

Please check the following.

  • Is the name of the data to be sampled correct?
  • Is the data from the last step still available? Have the results disappeared?
  • Are you sampling data from the surface of the geometry or outside the calculation domain?
  • When you look at the results in Paraview, do you see the same values?

Hi Kinonotofu,

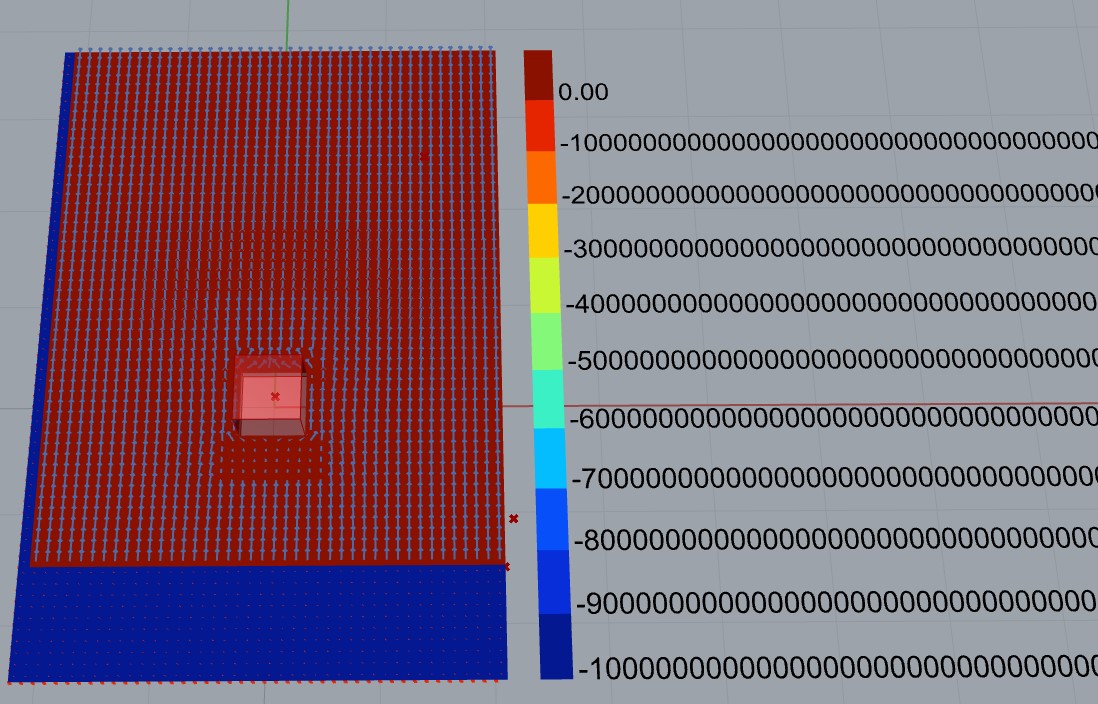
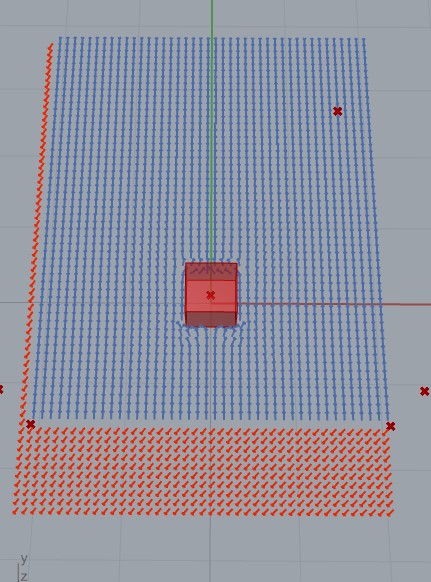
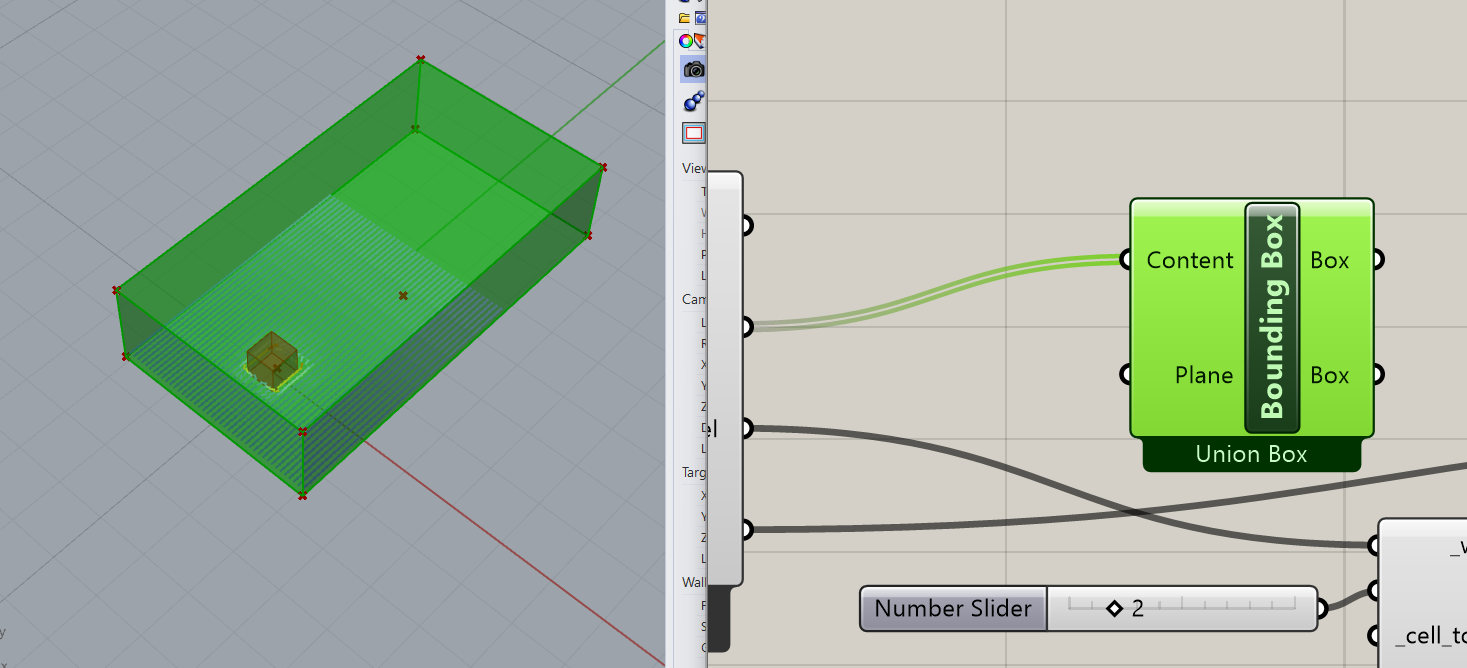
Thank you for your suggestions. Apparently, there was no issue with the code but rather it was the bounding box of the butterfly simulation and the horizontal and vertical plane was slightly outside that box which then caused the negative values in image 2.


The image shows the horizontal plane shown in both image 2 and 3 adjusted to be inside the bounding box.


Hence, the simulation is able to work.