Hi,
Trying to analyze the wind rose after applying a conditional statement i’m getting that the number of hours resulting from the histogram output exceeds the maximal number of annual hours, not to say the number of hours received before the statement.
The wind rose graph makes sense but the numbers don’t.
In the attached file you can see in the red groups the resulting number of hours (before and after the statement).
Will appreciate your comments (@SaeranVasanthakumar).
Best,
-A.
HistogramIssue.gh (62.1 KB)
@AbrahamYezioro
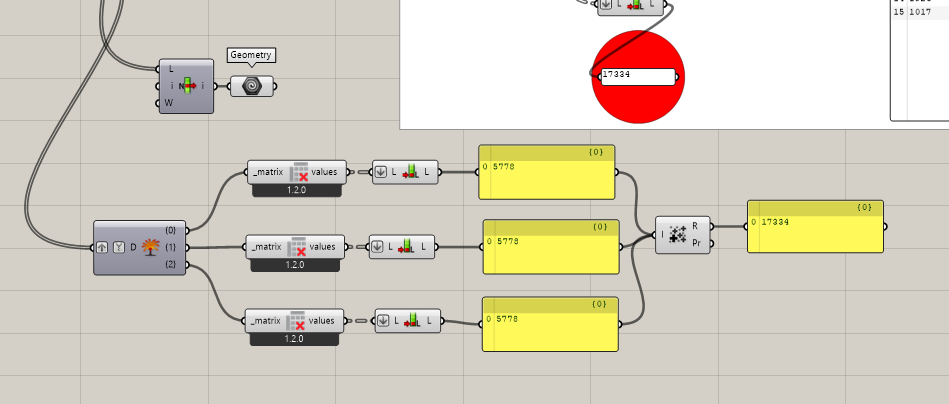
It looks like the LB Deconstruct Matrix component concatenates additional data to each direction bin. So since you are inserting three data collections (speed, drybulb, comfort) each direction bin has all three datasets aggregated in one bin.
The raw histogram output from from the Windrose component looks pretty good, there is a list of three histograms for speed, drybulb, and comfort, filtered by your conditional statement so each has a magnitude of 5778. 5778 x 3 = 17334. Putting them into the LB Deconstruct Matrix without any preprocessing is what’s causing the problem.
To work with them, I suggest using the list item selection, or grafting and exploding a tree of the histograms. Then you can calculate per-direction metrics for each intuitively.
Hi @SaeranVasanthakumar and thanks,
Funny. Just now i get to the solution you proposed and was about to report back here. You get me by a few minutes.
Thanks again!!
-A.