Hey,
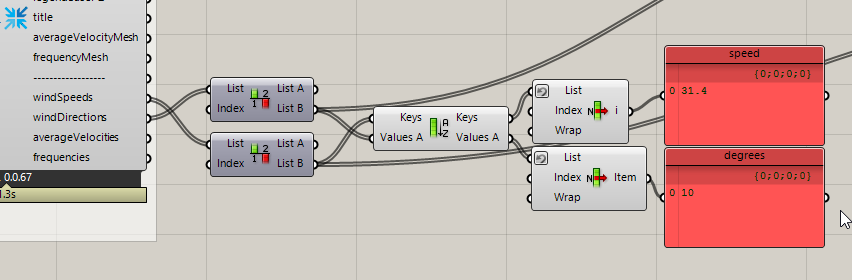
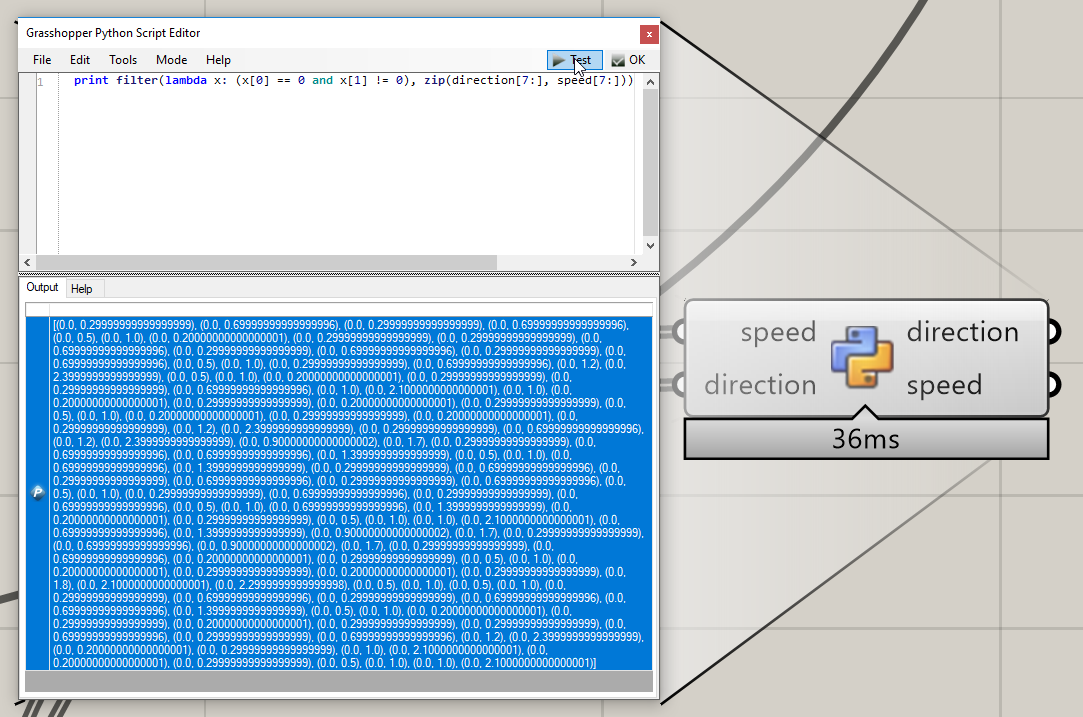
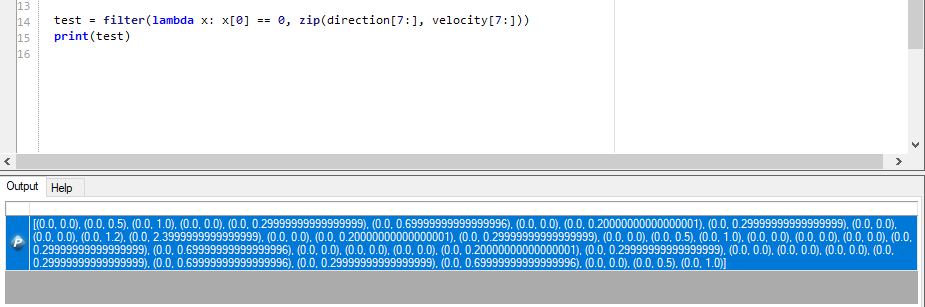
I’m getting some odd results using the windrose with an epw from Stockholm, Arlanda. Sorting the dataset and looking at speeds and directions the data about the strongest winds looks like this:
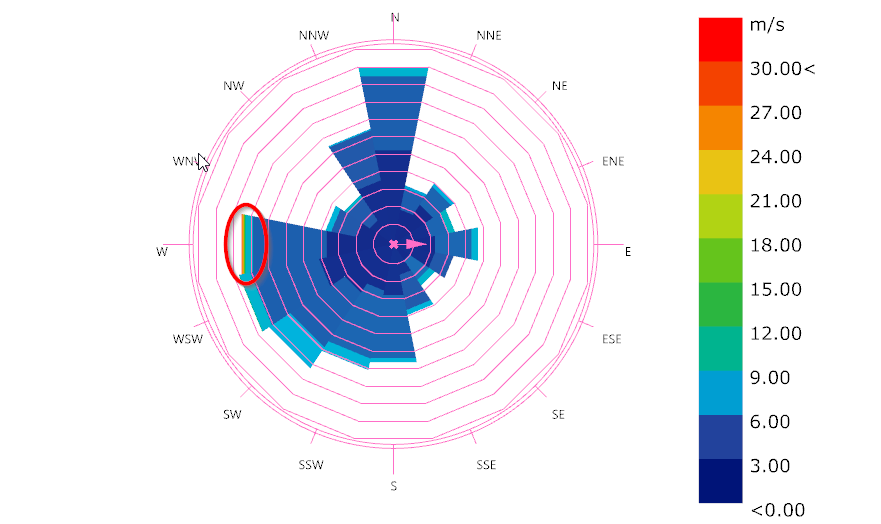
In the windrose (ill post below to workaround the one image per post policy) the strongest winds are plotted from the west, and not north (10 degrees) as the dataset dictates. How are degrees interpreted by the windrose component? I assumed north would be 0, east 90, south 180 and west 270…?
If west is set to 0 degrees, this particular case would be correct - does windrose for some reason assume 0 degrees to be west?
Note the strong wind is coming from west not north.
EDIT
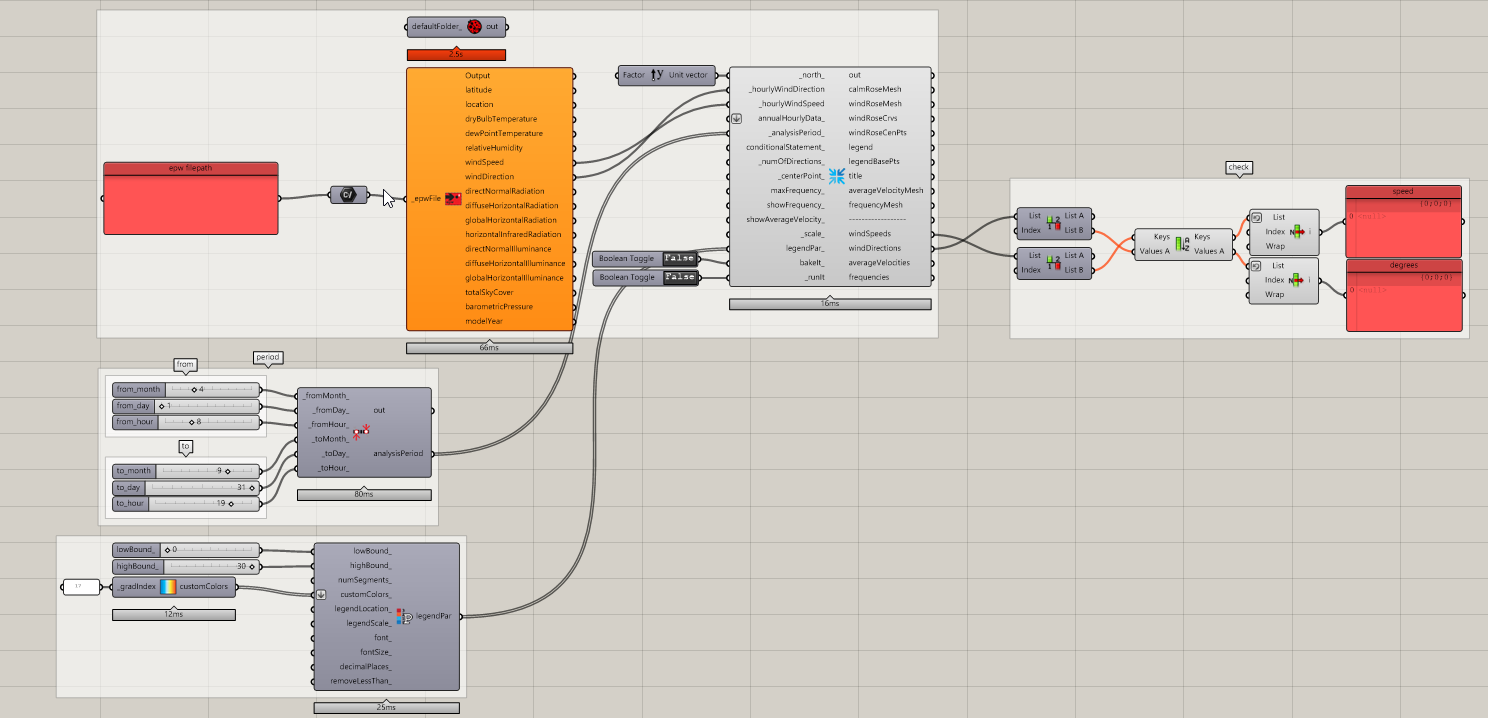
I’m using analysis period for the windrose. It seems all is working fine without it, but when I enable it the graphical representation turns incorrect.
I use epw from Stockholm, Arlanda Airtport. LB version is 0.0.67 and BF i think is 0.0.05 (latest on food4rhino) The anaylysis period is från 1st of April to last of September, between 08:00 and 19:00, described as tuples it would be from (4, 1, 8) to (9, 30, 19).
I have a hard time to see how there can be a problem with the period though - shouldn’t all periods that the LB analysis period node produce be valid?
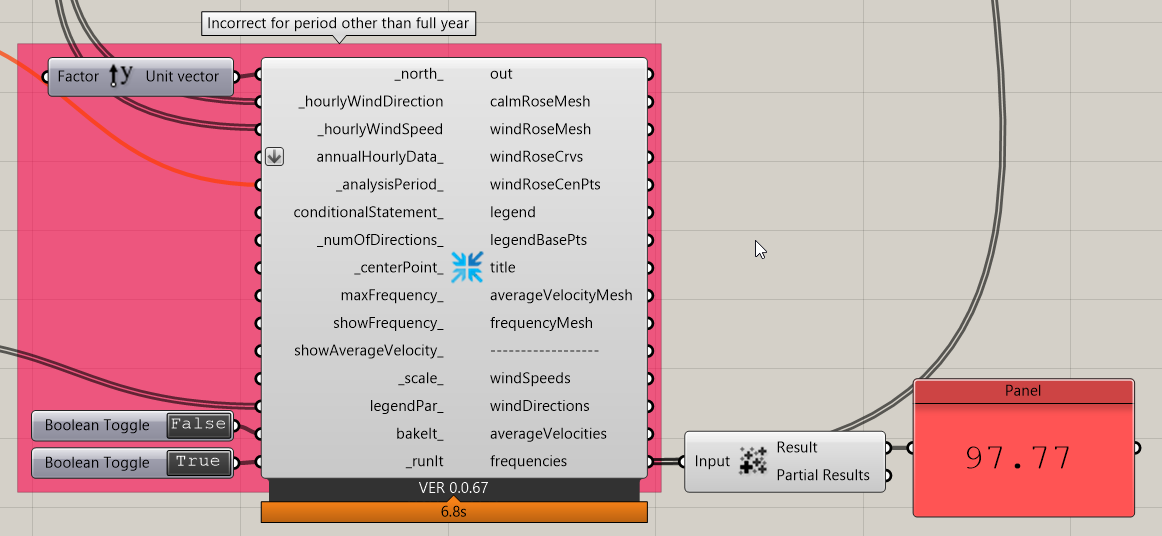
I haven’t gone in depth with this, but I suspect it doesnt take into account that both 0 and 360 degrees are north in the epw. My guess is that data with direction of 360 degree is ignored, but that it still checks against the full length of the epw file, hence the sum of % is not 100.
I am still trying to wrap my head around the orientation issue, but as for the mass addition of the frequencies, I don’t think you are right. The windrose for the chosen data file states “calm for 2.24% of the time” which in addition to the 97.7 % gives 100.1 % probably because of the rounding of the numbers.
Ah, thanks zdenom, without looking into it, that sounds correct - my bad!
The graphics of the windrose still seems incorrect tho.
EDIT
Looking into this a bit more it looks as if winds from 0 degrees never are of any high speeds - is this my chance or specified by the epw format? I do find calm states on other directions also tho, so there’s no real consistency to the pattern. Here’s what it looks like:
I think you should try backwards and see if there is any hour with winds-peed 0 that comes from a different direction. My understanding is that when the wind-speed is 0 they leave the orientation as 0. That’s why we collect all the hours with 0 wind speed and put them as calm hours instead of adding them to the frequencies.
I’m not sure if I follow your comment about direction but 0 in the epw file is indicating north.
Hey @mostapha
I looked into it abit, and it seems all 0m/s wind speeds indeed come from 0 degrees - all winds from 0 degrees are however not 0m/s. Some winds from 0 degrees are around 2m/s, so it seems not all of them can be assumed to be calm conditions.
@mostapha
It appears as if the windrose component is displaying incorrect graphics when used together with the analysis period component (se images above). In the .epw weater data there are no wind speeds of 31m/s coming from west, they’re coming from the north (0 deg), but it still plots them as coming from the west (see image). Is there anything I’m missing here… any simple fix?
The wind rose is averaging the data and not showing min/max occurrances. Just for the sake of it, try defining an analysis period narrow enough that you can see those data. Not sure the component can get just one hour but try to give, say, one day. Then you’ll see what you are saying.
Hope that makes sense to you.
-A.