Hi!
I’m a new user on Rhino/Grasshopper etc. I’ve tried the simple UTCI calculation example file from hydra: http://hydrashare.github.io/hydra/viewer?owner=chriswmackey&fork=hydra_2&id=Urban_Microclimate_-_Simple_Spatial_UTCI&slide=0&scale=8&offset=-2962.6158332386294,-1736.7221487615252
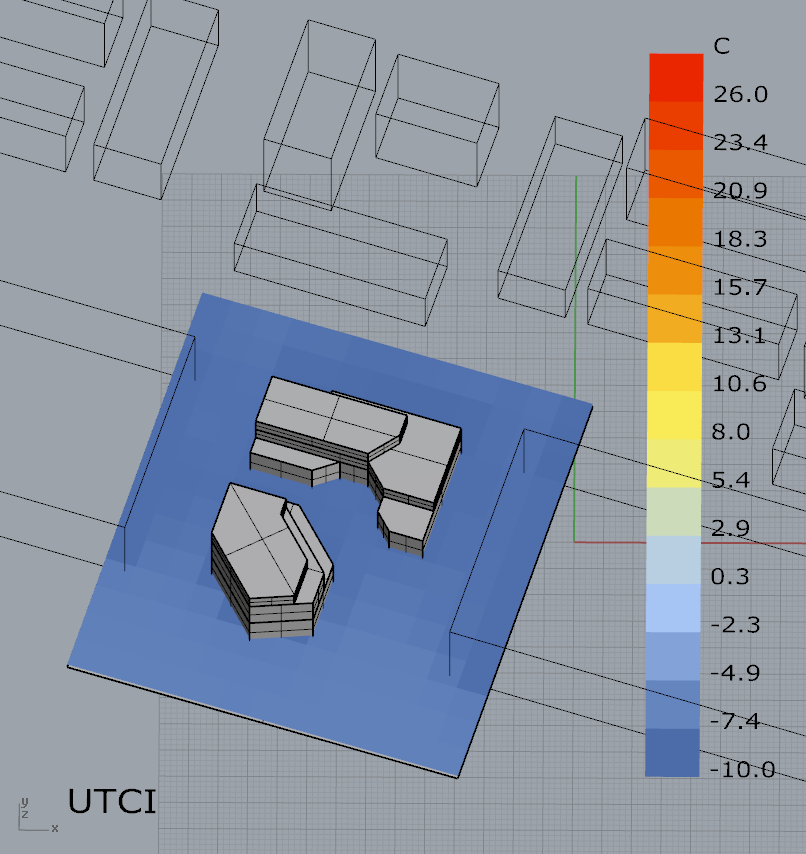
I adjusted it to my Rhino file and set downloaded the epw and stat file for Copenhagen from Energyplus and set the time period to be September 21 at 8-20, but the output seem off. The analysis sets the temperatur to be around -5 - -10 degrees Celsius which doesn’t agree with the average temperature to be around 10-15 degrees Celcius.
I tried to run the analysis for the standard time period “ExtremeHotWeek” ass well where the output doesn’t seem to be extreme hot being around 17-18 degrees Celcius.
I don’t believe the UTCI to be that much lower. What have I done wrong?
All help will be greatly appreciated, thanks!
Files:
https://we.tl/t-LsCm95M8Ex

