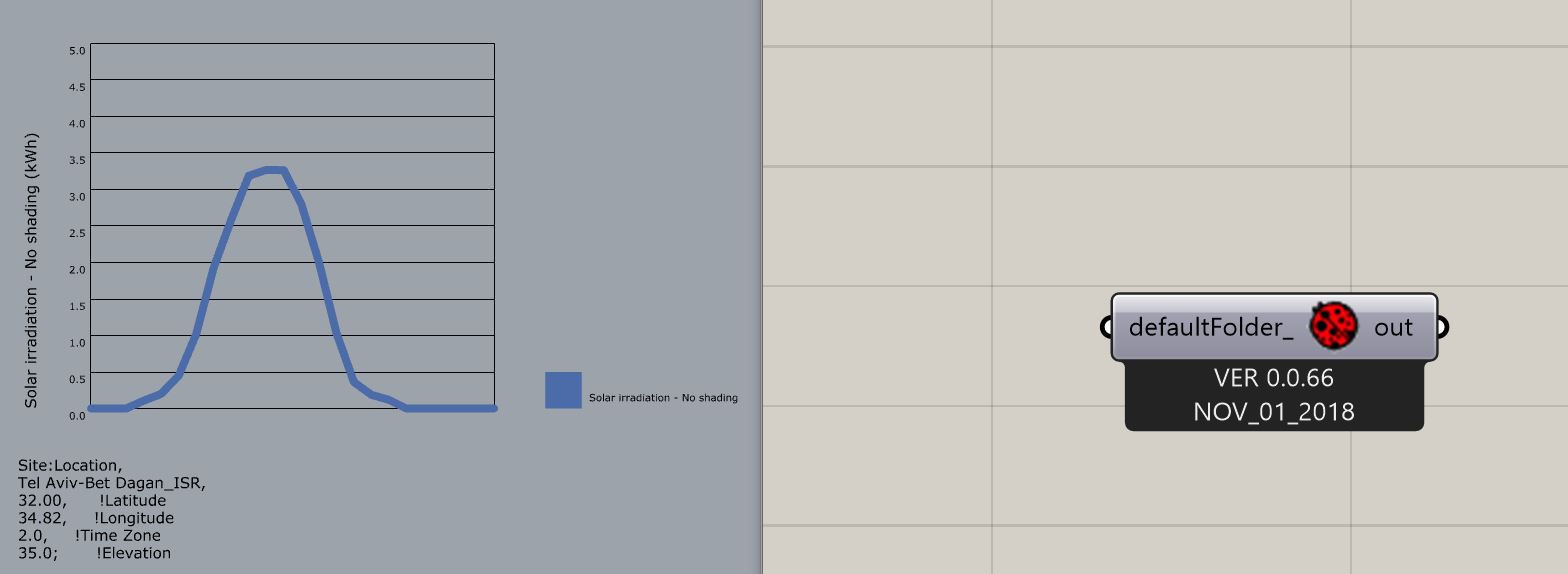
I can’t seem to find how to display the values on the x-axis using a ‘Ladybug’ Line Chart . I am plotting insolation data on a window on a certain day and I would like to have the hours of the day displayed.
I seems like it should be something easy, but I can’t seem to find it.
Edit: here is my file if it can help: LadybugLineChart_x_axis_Display.gh (42.2 KB)
Indeed very simple but … you were missing the LB_LB component. Without it nothing will work (mostly).
Just insert it, bring it to front (ctrl + F) and recompute.
-A.
Hey thank you for your answer!
I’m sorry I think my question was not clear - I want to have values on the x-axis like : 0:00 -1:00-2:00 etc.
Like on a normal excel graph.
But true I was missing the ladybug! (this is just a part of the whole code for which I already had the ladybug runinng so it worked)
Oh,
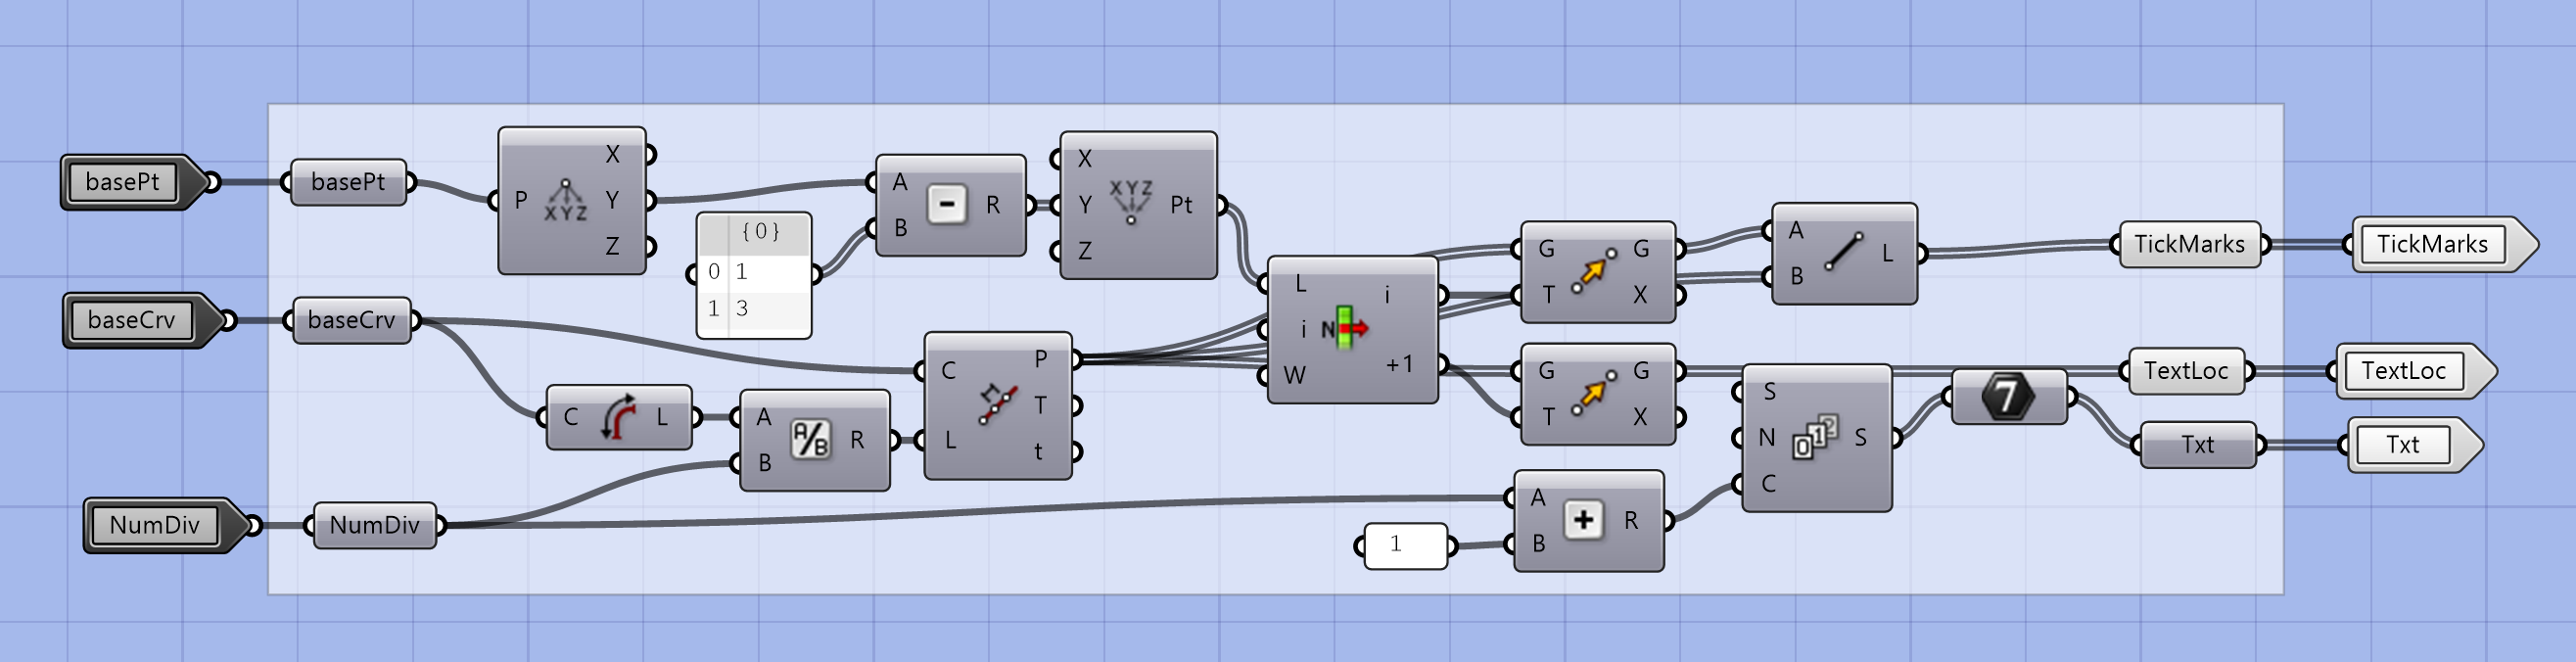
The component doesn’t have an option to show the horizontal axis.
Can’t think because it doesn’t know what the text/scale should be. For you is clear that it is 0 to 24, but this is not an input. In excel you do provide this info.
@AbrahamYezioro answered the question well but I just wanted to add that sensing the x-axis labels for all possible data types is very complex to code and, especially when we are just re-creating the capabilities of Excel, it hasn’t been high on our priority list.