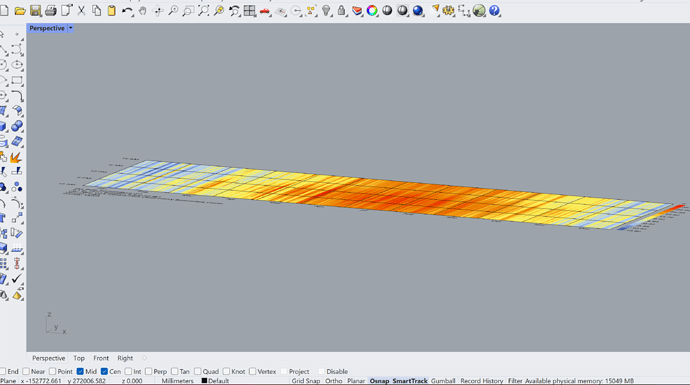
Hi there. I am a new user, following the tutorial in this playlist: Weather Data Visualization - YouTube
In the Hourly and Monthly Chart video, I found problems with the number slider at 5:15. If I try to resize using the slider by attaching to either _x or _y_dim then the chart disappears. If I connect the slider to only the _z_dim then it does nothing in any of the 4 default views in Rhino 7. Any advice for a newbie?
Thanks,
Nick

