Hello,
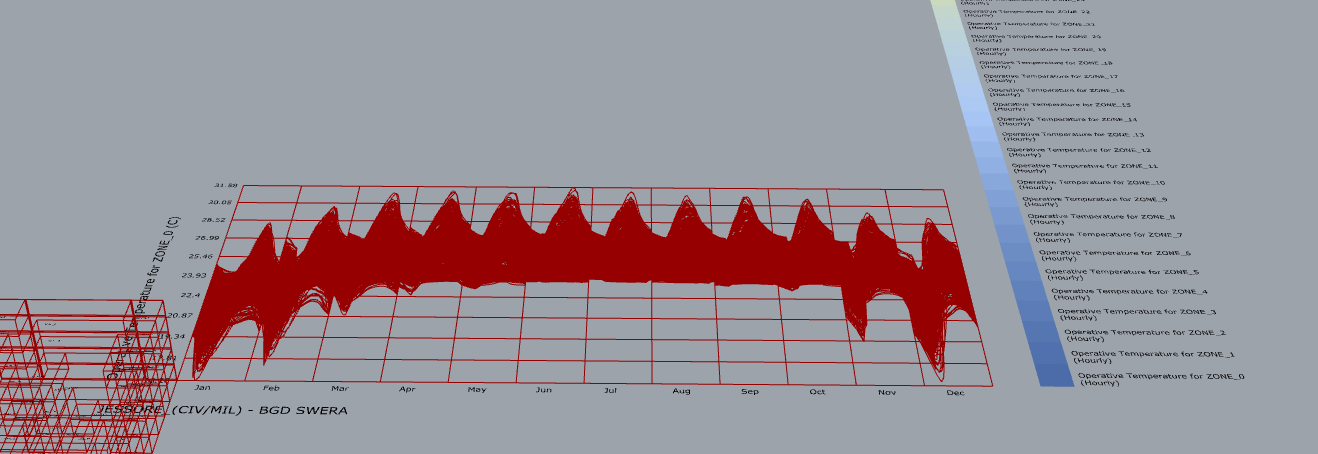
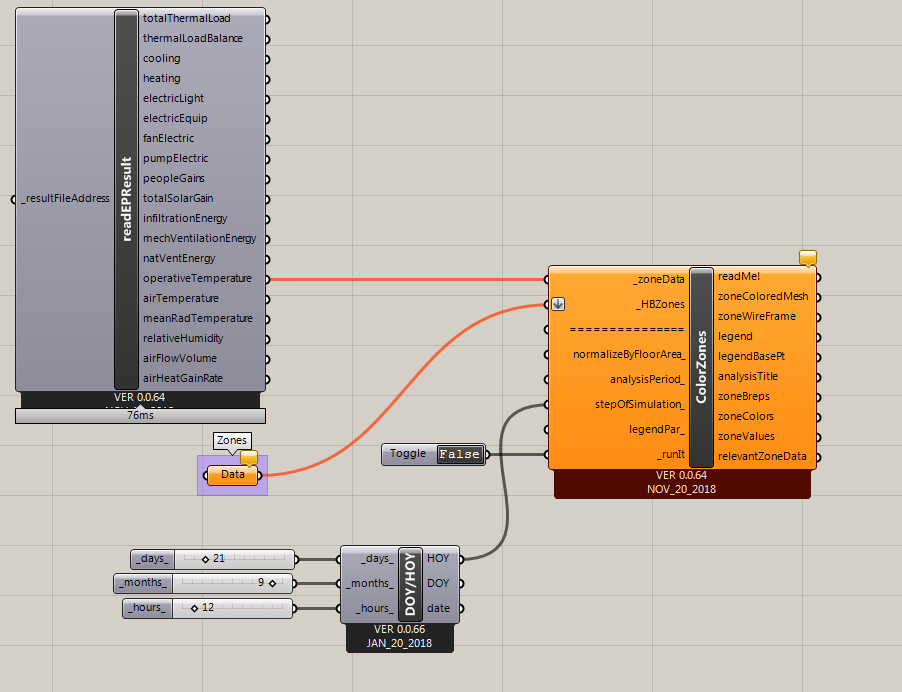
I would like to visualize the operative temperature. The building model consists of 66 zones. I tried ladybug monthly bar chart which is not the right way to visualise because it shows the result of all zones on the same plot. How can I visualize results of only one zone at a time?