I have lots of experience at simulation, not so much with Rhino/Grasshopper. I have a process that generates energy performance for 10 zones in a multi-storey building: on the floor above the ground floor and the floor below the top floor.
When I link the output to the reporting / graphing tools I have the mismatch illustrated below. 10 zones x 8760 data points into the dry bulb and radiant temperature inputs (dotted links in picture) AND only 8760 data points for the Outdoor temperature and wind speed. As can be seen this creates a mismatch in types of lists that I am flummoxed by.
I get that the former two links are lists of list; and the latter two are lists as a labelling exercise, but yet understanding how to handle the processing of these lists so they are compatible is beyond me.
Hello again. This is an issue that has come up again for me. What I am interested in is being able to create multiple graphs of output Zone by Zone. The Example model provided in answer drew two adaptive comfort plots one on top of the other. There seemed no way to separate them.
I am wanting to create something much more informative than just adding the output for all Zones together and plotting them against the outdoor climate.
The issue is:
I can see that the output of an annual run produces 8760 lines of hourly data times the number of output variables with an allowance of a few lines as headers.
I was running energy performance calculations where I wished to compare the monthly energy balances for a set of zones at one height in a building and compare them with another set of zones at a different height, singly and in groups
I also wished to run a simulation for these same zones where I wished to compare the zones in terms of their floating point performance with only natural ventilation and no heating or cooling provided by ,mechanical means. I cannot do these calculations one zone at a time, I wish to run once and compare the 10 or so zones that I have created.
finally, this has come up again in adapting the new Energy Balance Hydra example file for another purpose: I wish to run multiple zones and produce energy balances and temperature profiles for multiple zones. will allow me to separate the two test zones I have created thus far; but its output does not seem compatible with the Results File Address input requirements of the Adaptive Comfort and other summary calculators.
The attached files are
“Energy_Model.gh” updated for most recent version of HB/LB. This is the one that took the input from a stream of 2 zones x 8760 readings and graphed them, but, as far as I can see, it produces two graphs on top of each other if there is more than one zone.And
my tentative adaptation of Chris Mackey’s new MultiZone_Energy_Balance_Chart.gh example files; this produces an energy balance across all the zones. I am interested to learn what is the contribution of each to the total.
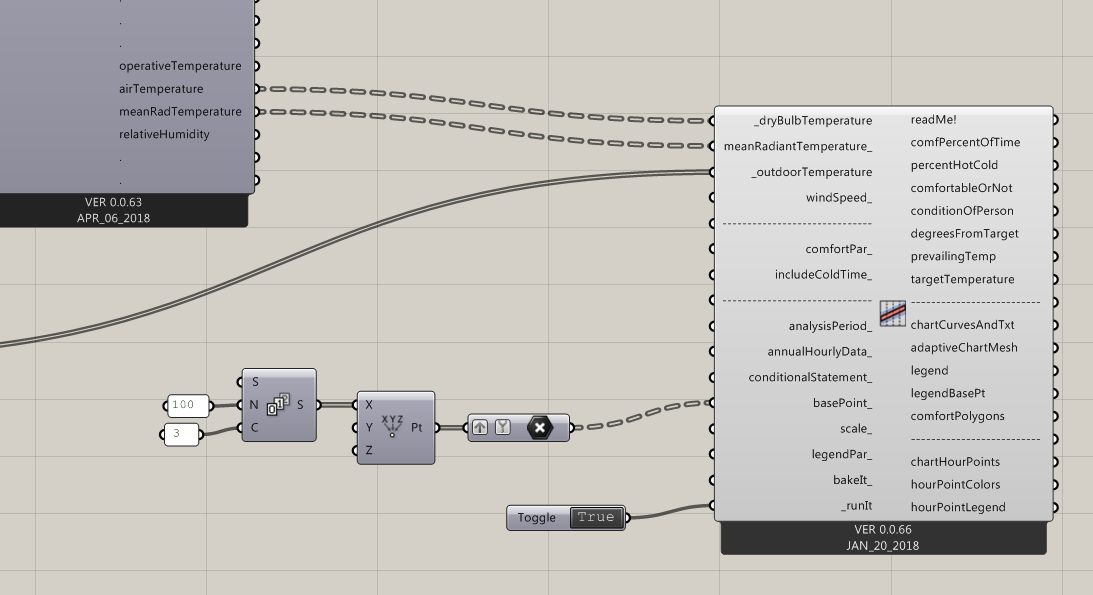
@MichaelDonn ,
To create two or more adaptive charts that are not on top of one another, plug a grafted and simplified list of base points into the adaptive chart like so: