Kia ora @Naga
Thank you for your careful outlining of the differences that appear between your two models built into your demonstration script.
Apart from changing the geometry, and updating the version of LadyBug Tools, I was assuming that the two examples you showed in your workflow were only different in the application of the CFD estimates of wind pressures.
However, it would seem that there is more happening inside the calculations that you are performing than merely applying ventilation wind pressures.
I am sorry to keep bothering yoou, but, in order to understand this further, so I could describe the situation to my Masters students, I have dug into the actual differences between these two runs, and I am more deeply puzzled than before.
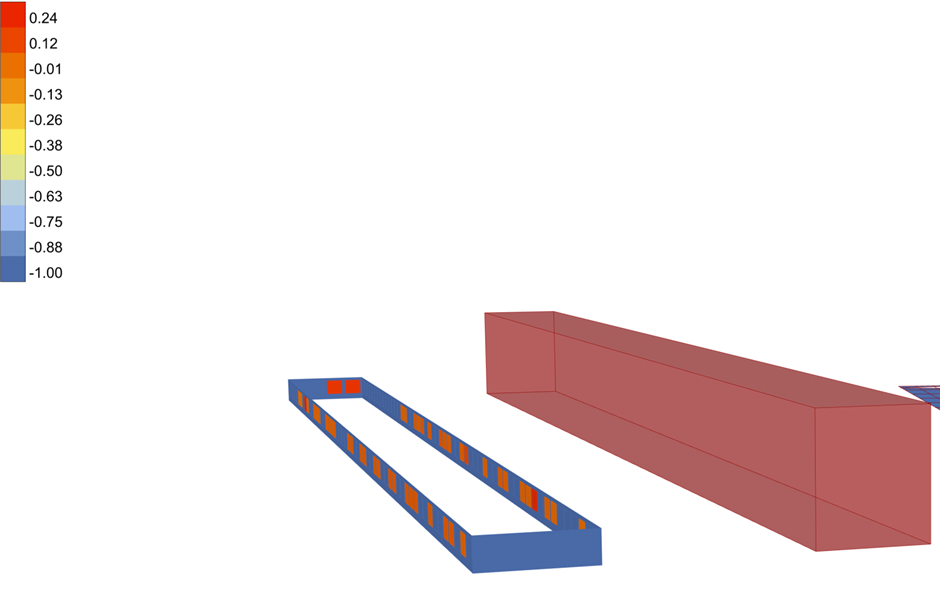
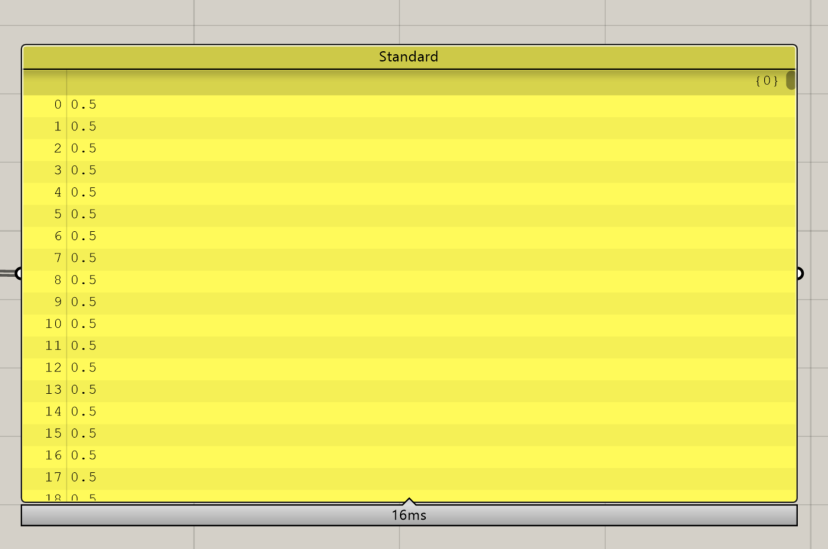
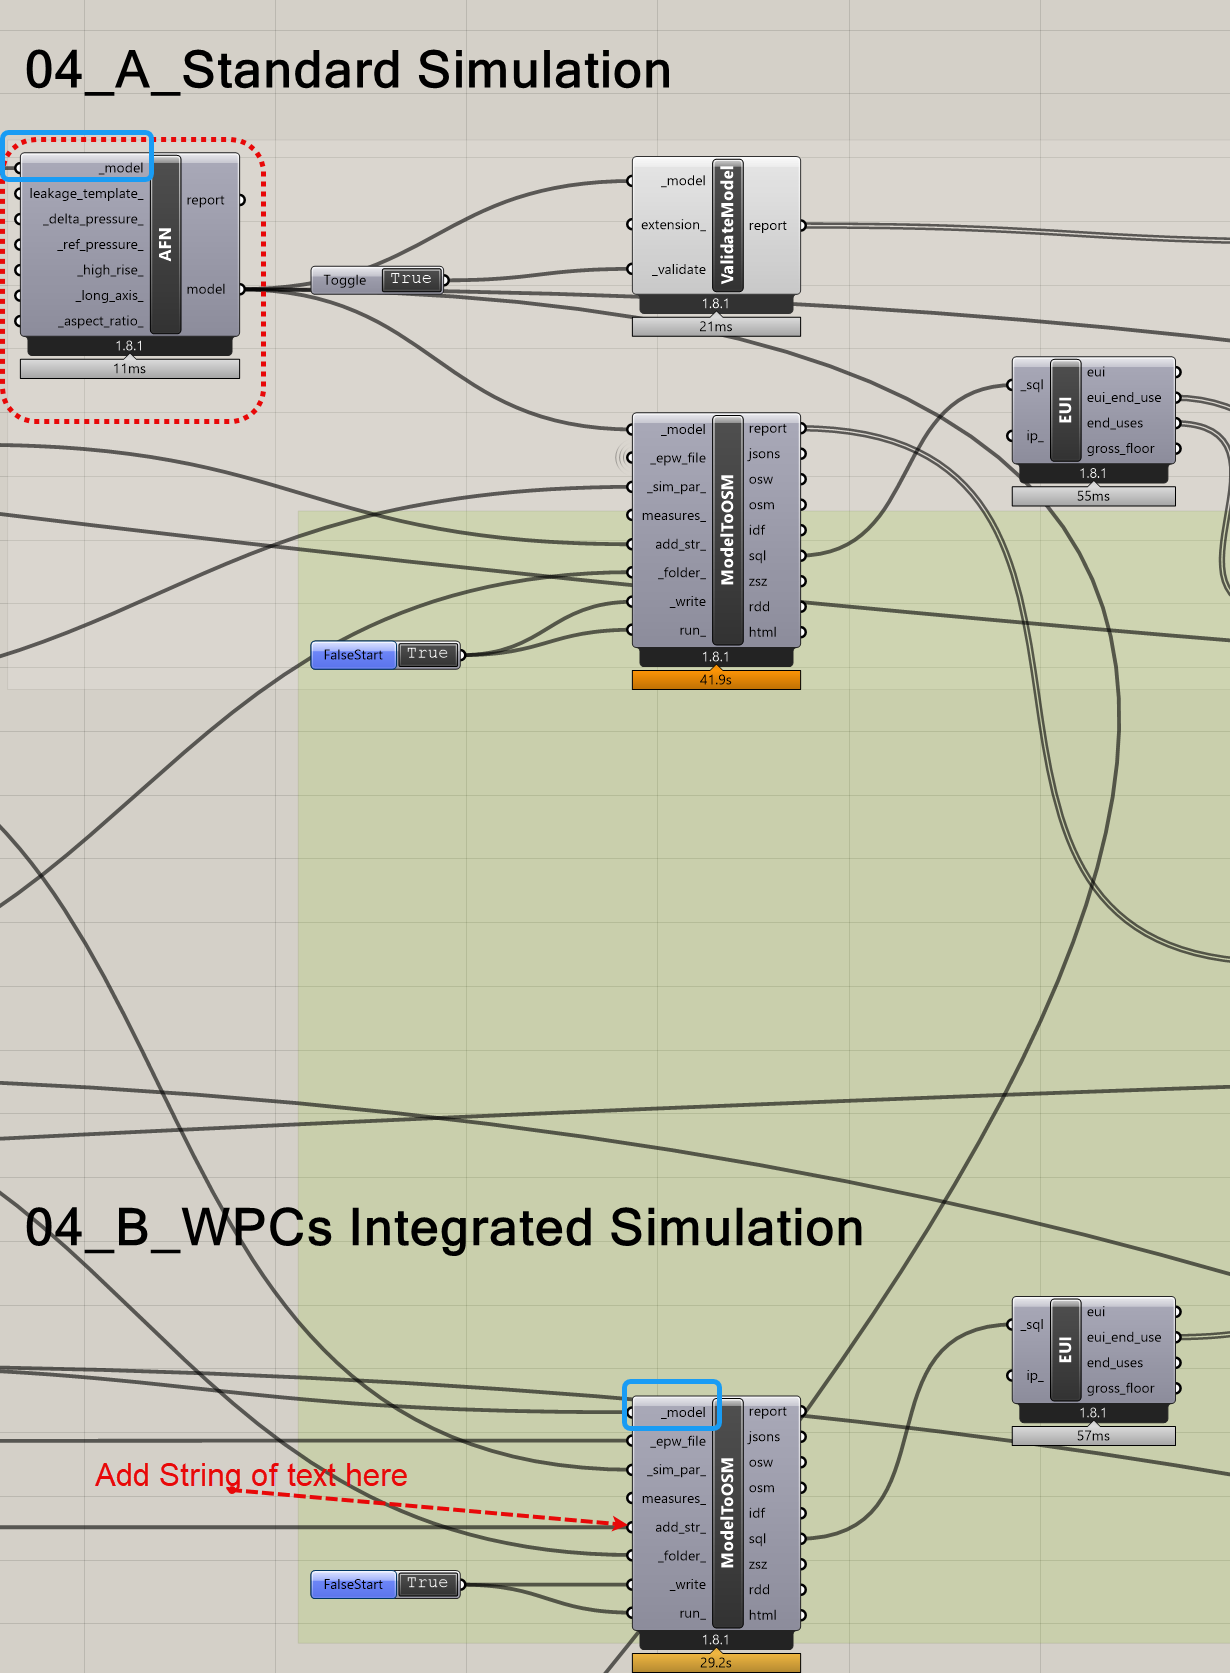
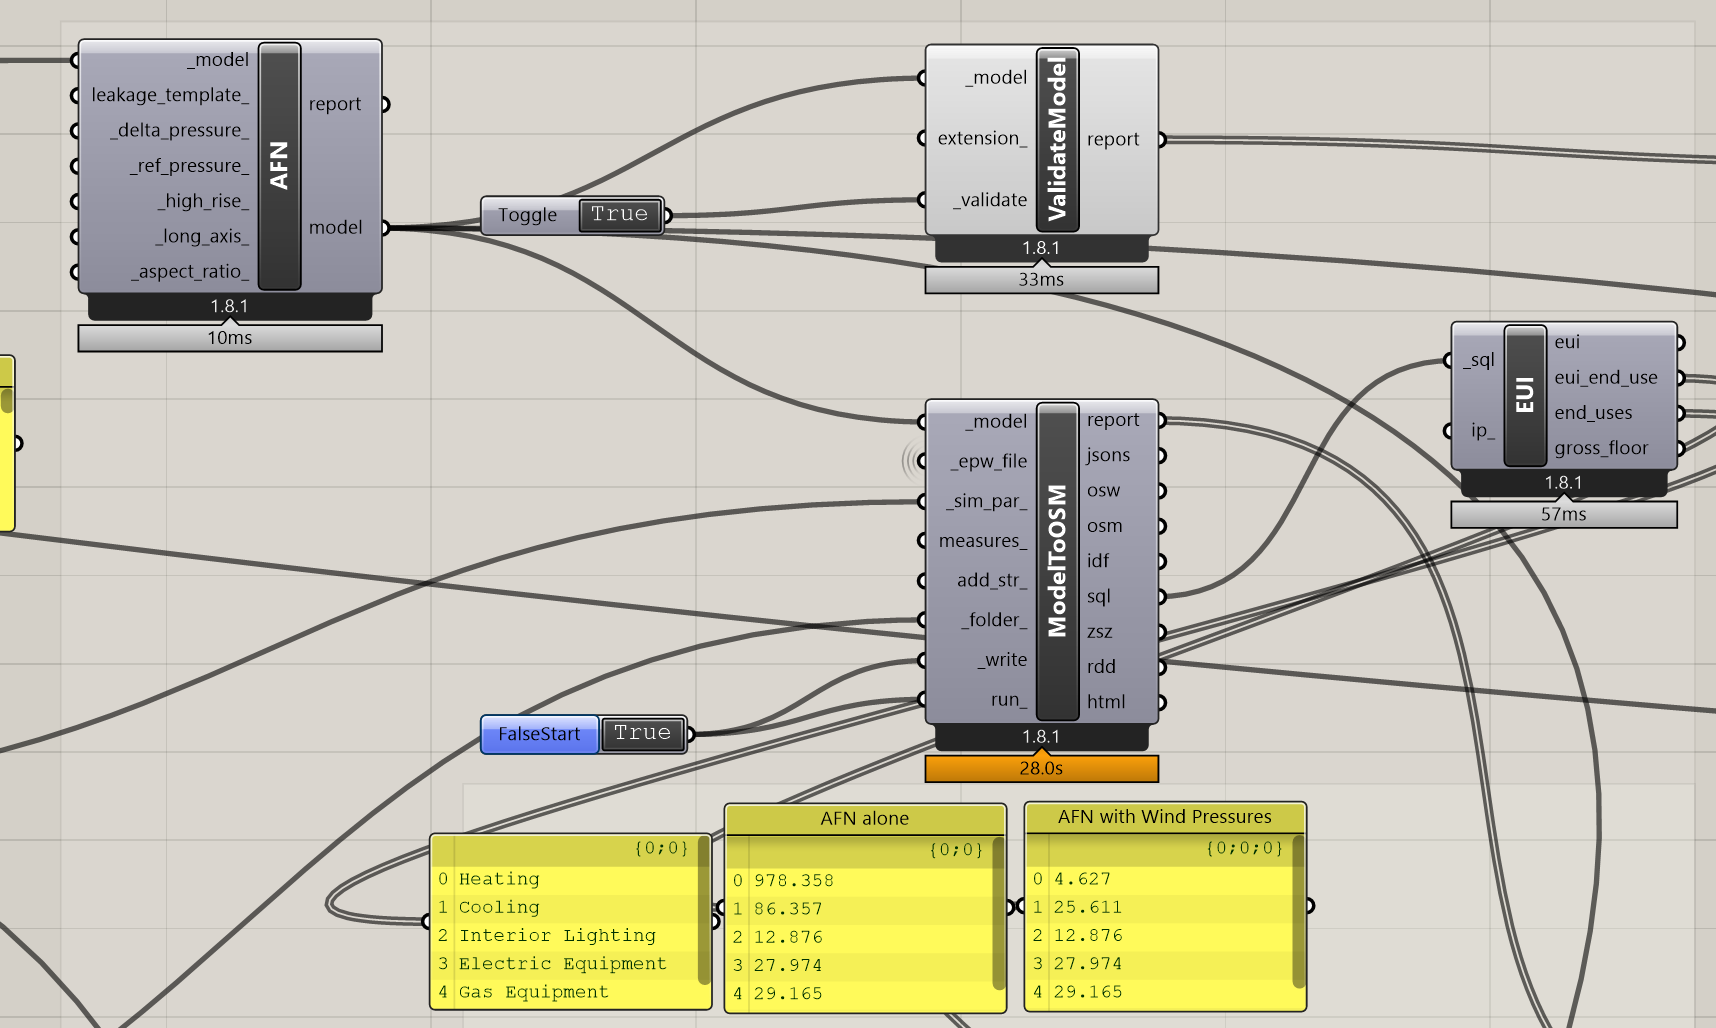
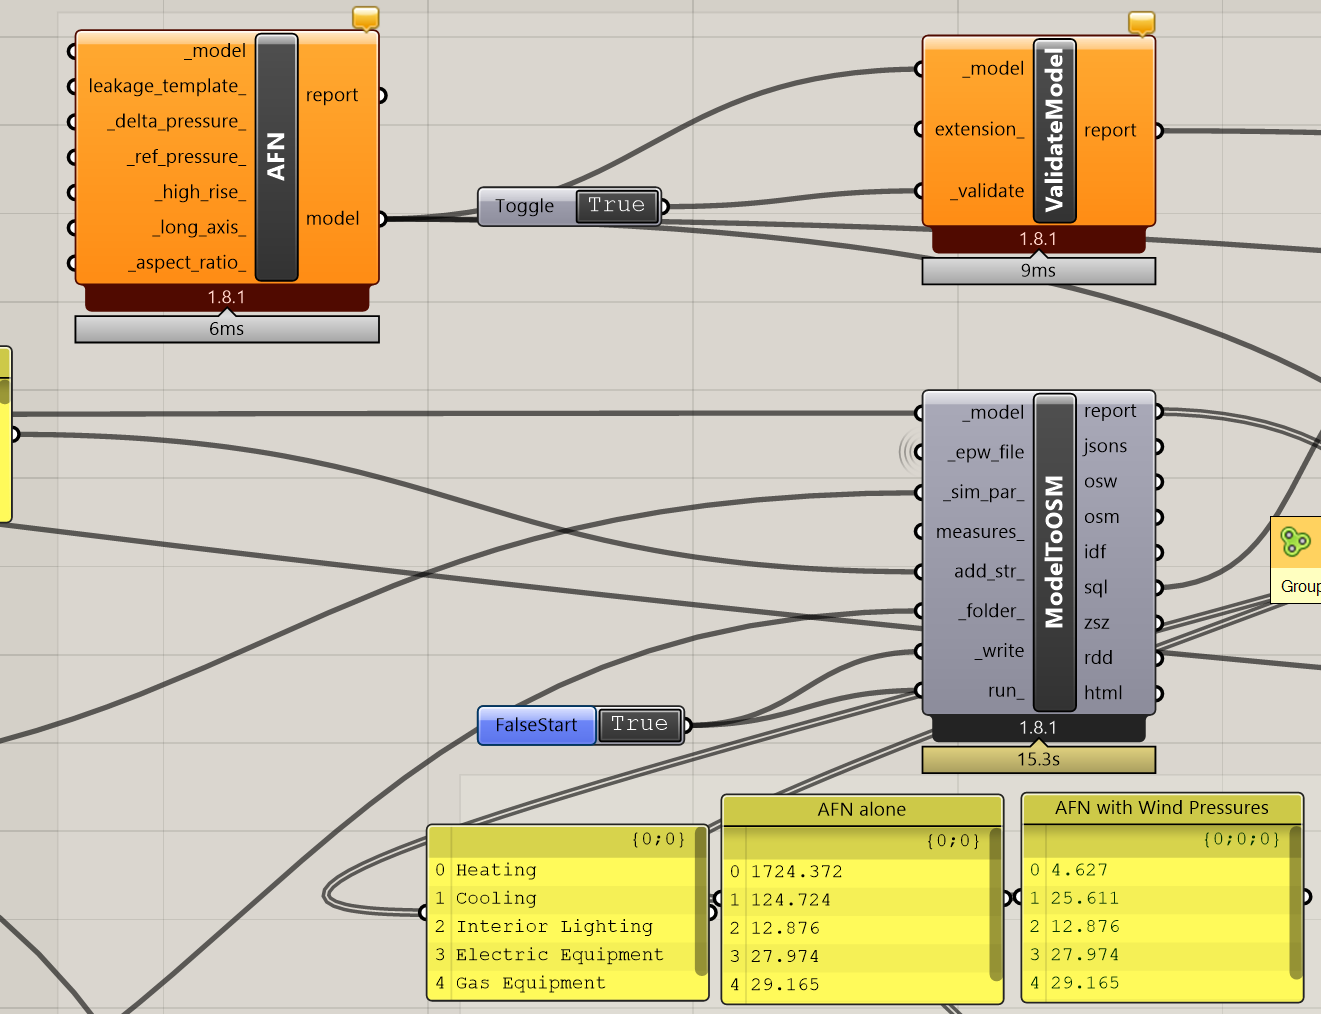
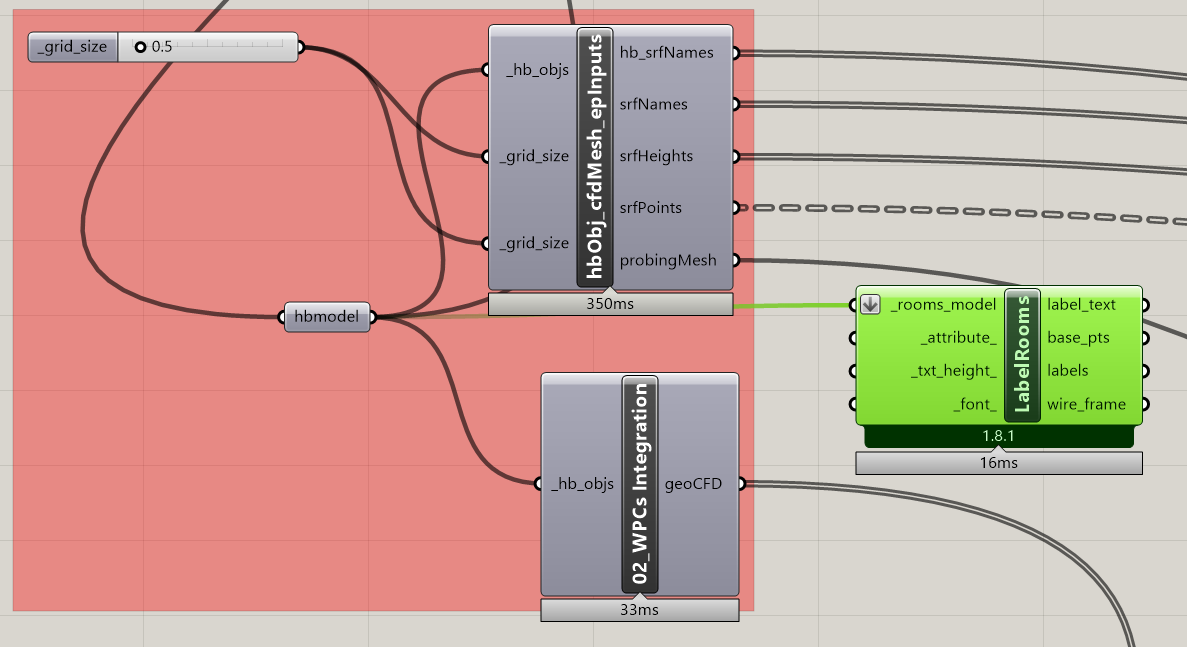
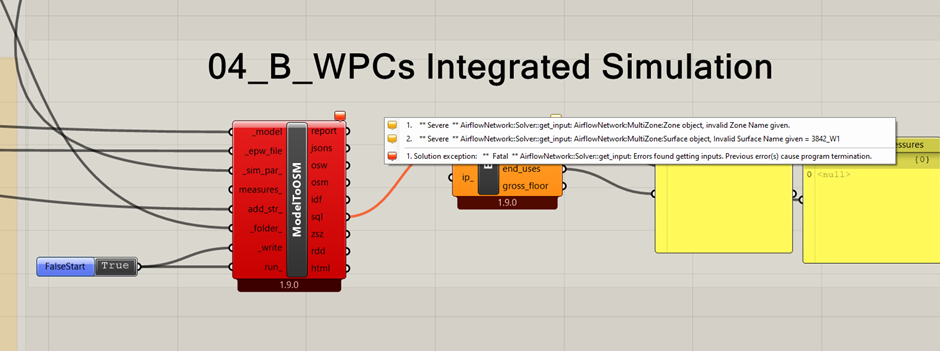
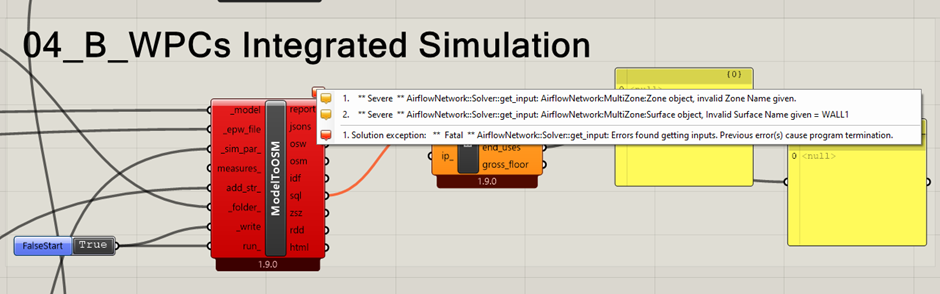
As I understand it, the model for the “Standard Simulation” is the exact same model that has been fed into your CFD analysis to create the. The difference between the Standard and the WPC Simulations can be seen in this screen capture
.
The base model that was fed into the Pressure Coefficient calculations is connected at the Blue boxes. Thus, it can be seen that for the standard simulation a basic AFN Airflow Network Component is added in (upper red dotted box, with base model connection at blue box). For the Integrated Simulation, the model is connected directly because the AFN AirfFlow Network description is part of the text string generated by your CFD calculations and connected at the red arrow.
Thus, there are two differences between the simulations
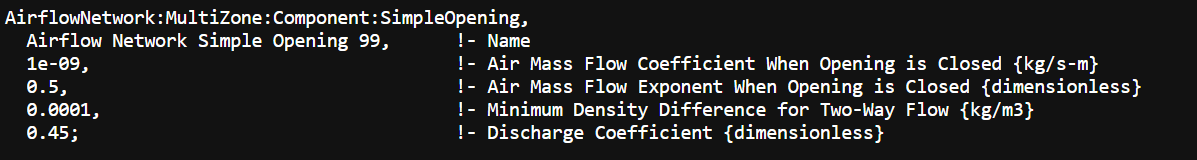
- addition of a very basic Air Flow Network definition, with basic default values, to the Standard Simulation that is not in the WPC Integrated simulation.
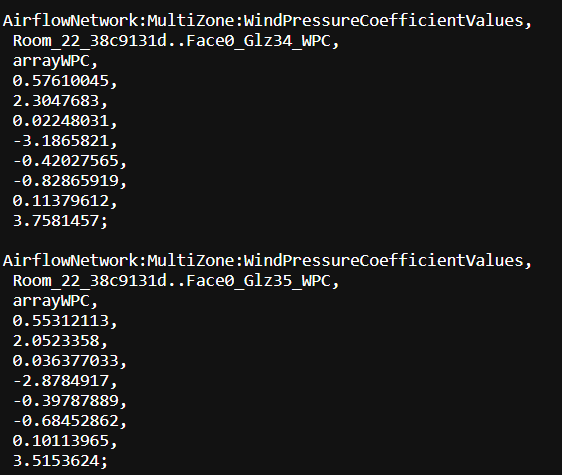
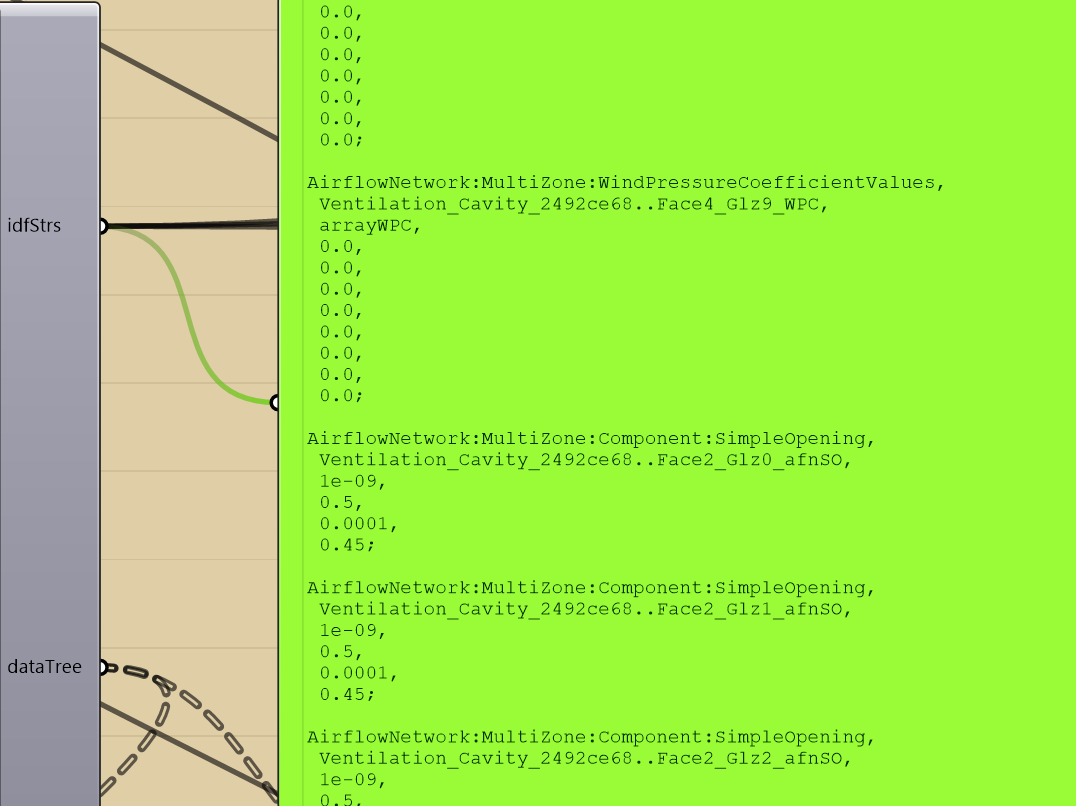
- addition of the airflow network definition with calculated wind pressures to the Integrated Simulation (arrowed entry) via an additional “text string”
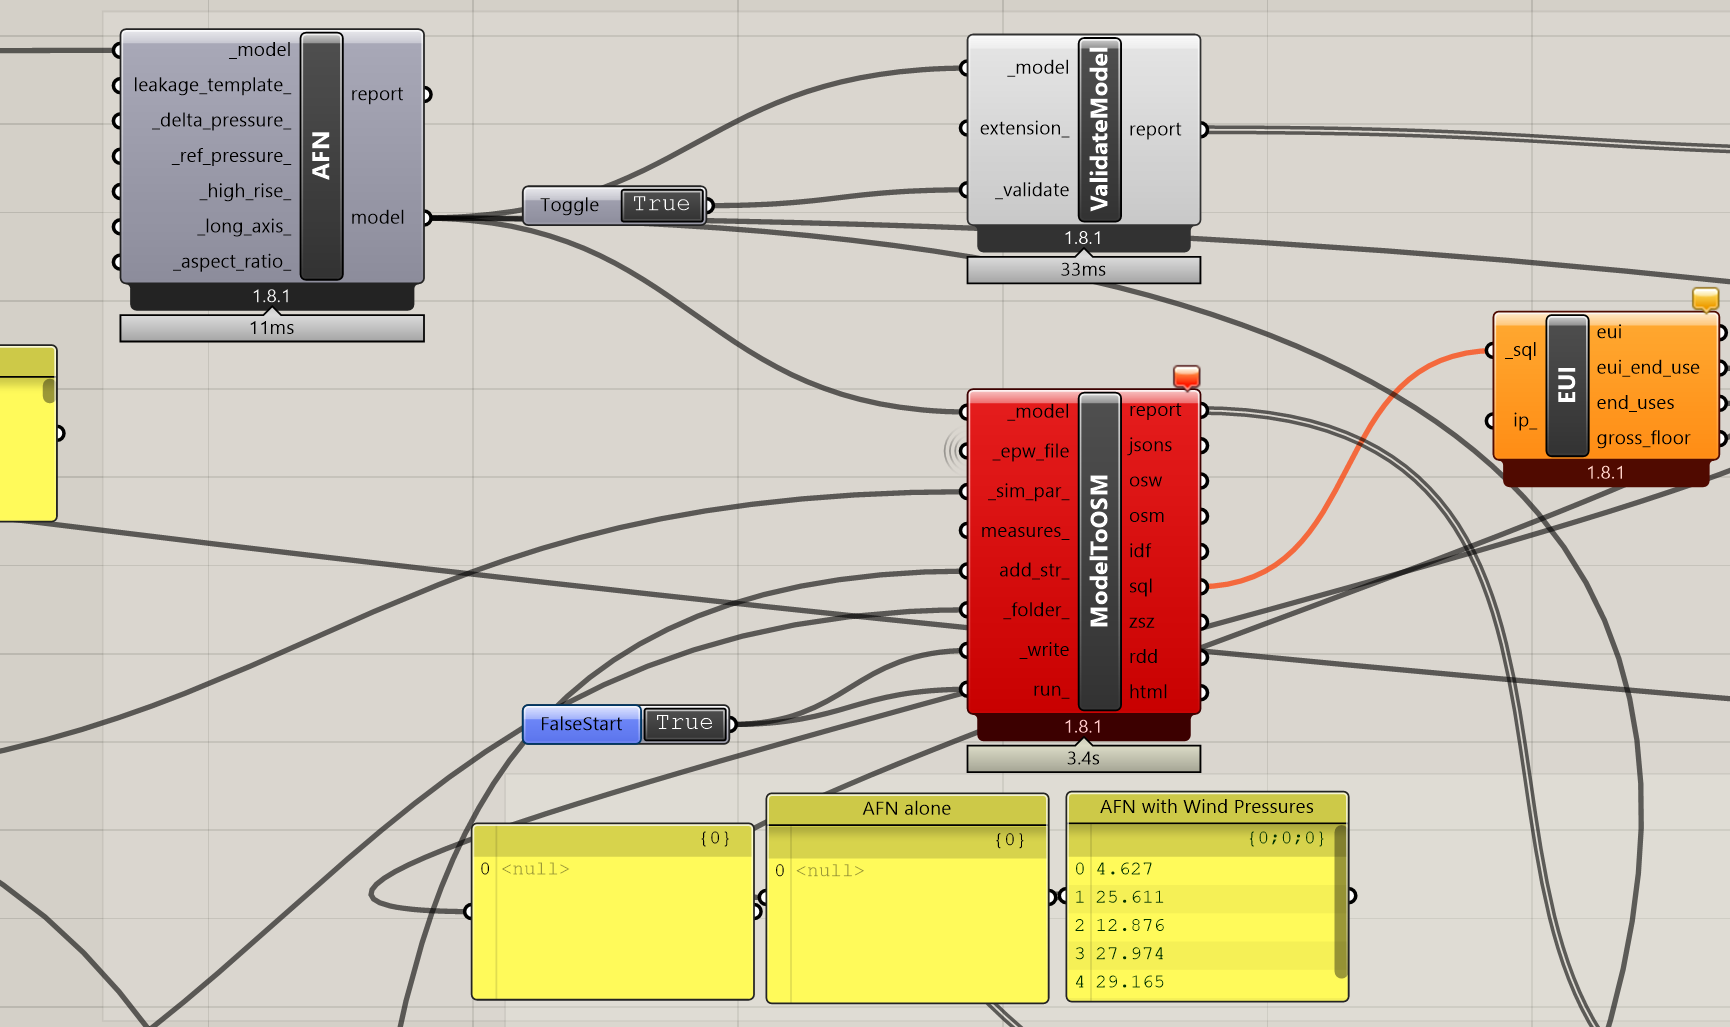
So, to understand the two calculations better, I tried rearranging the inputs.
I tried
-
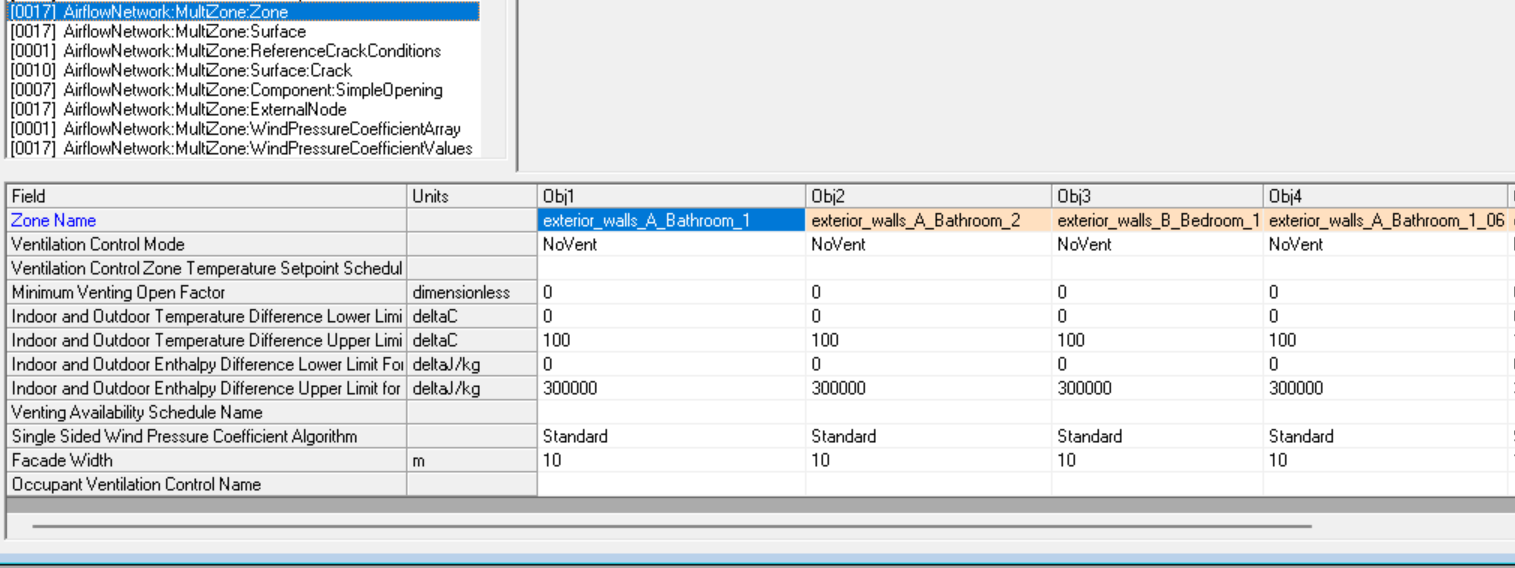
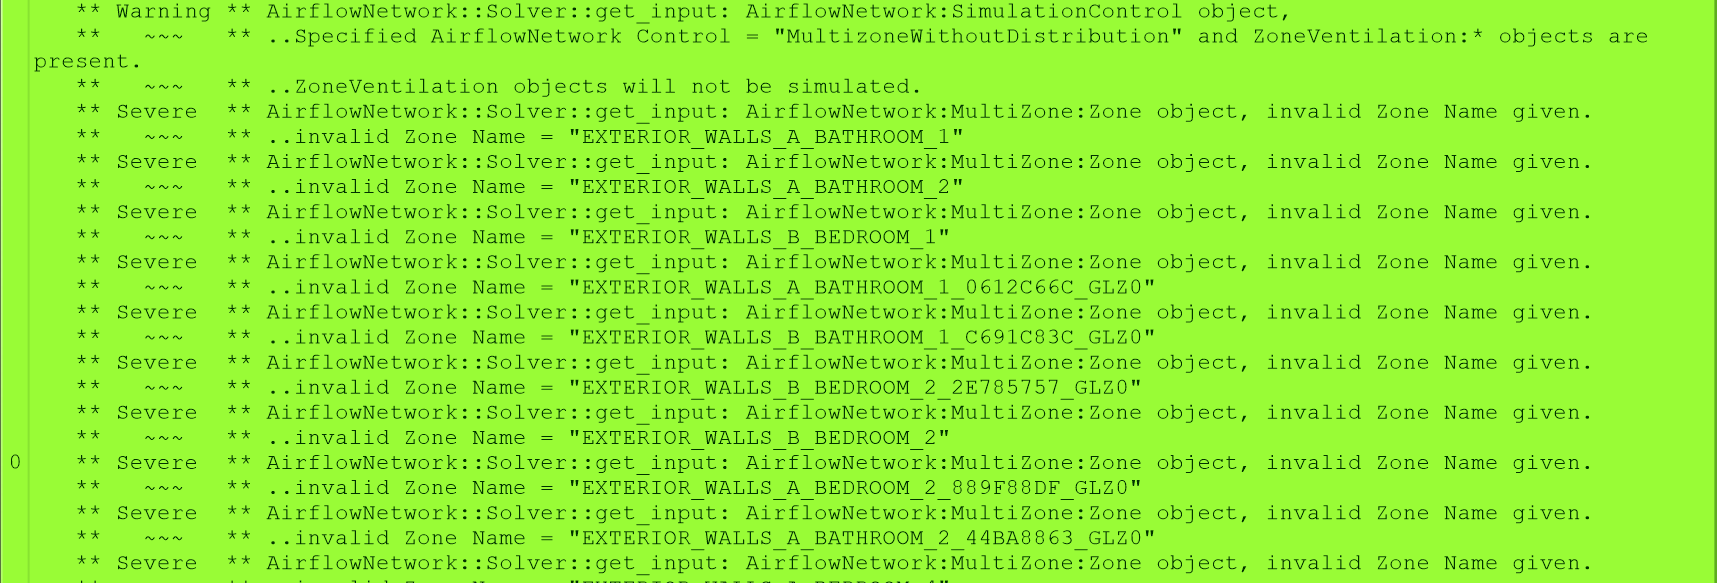
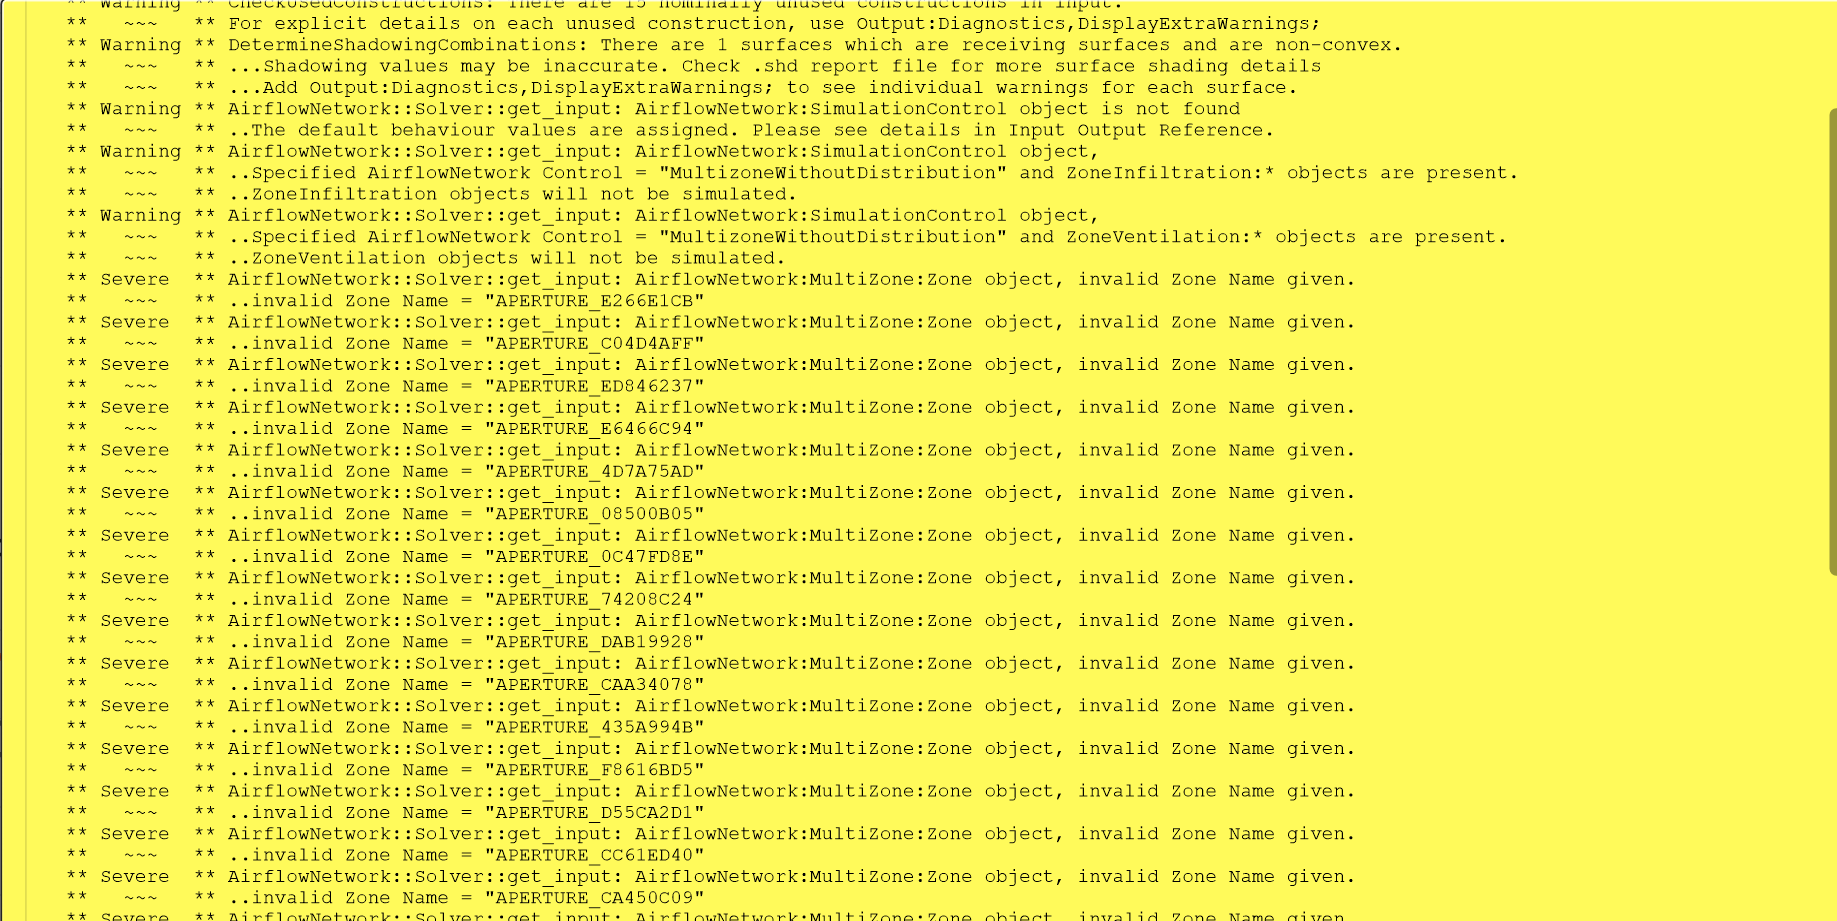
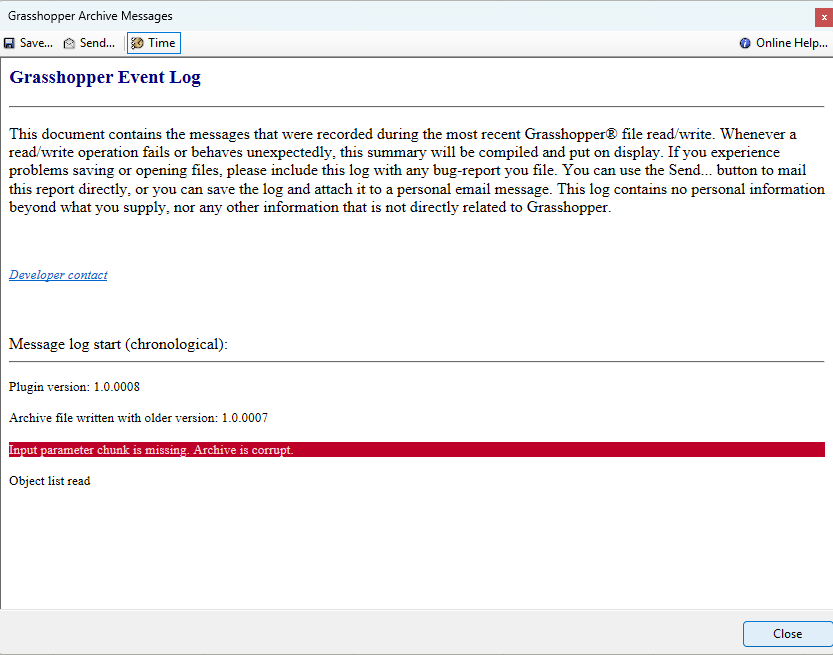
just connecting the additional WPC text string to the standard simulation - crash, object naming issues
-
bypassing the AFN definition for the Standard Simulation and connecting the WPC text string - outputs identical, as hoped for
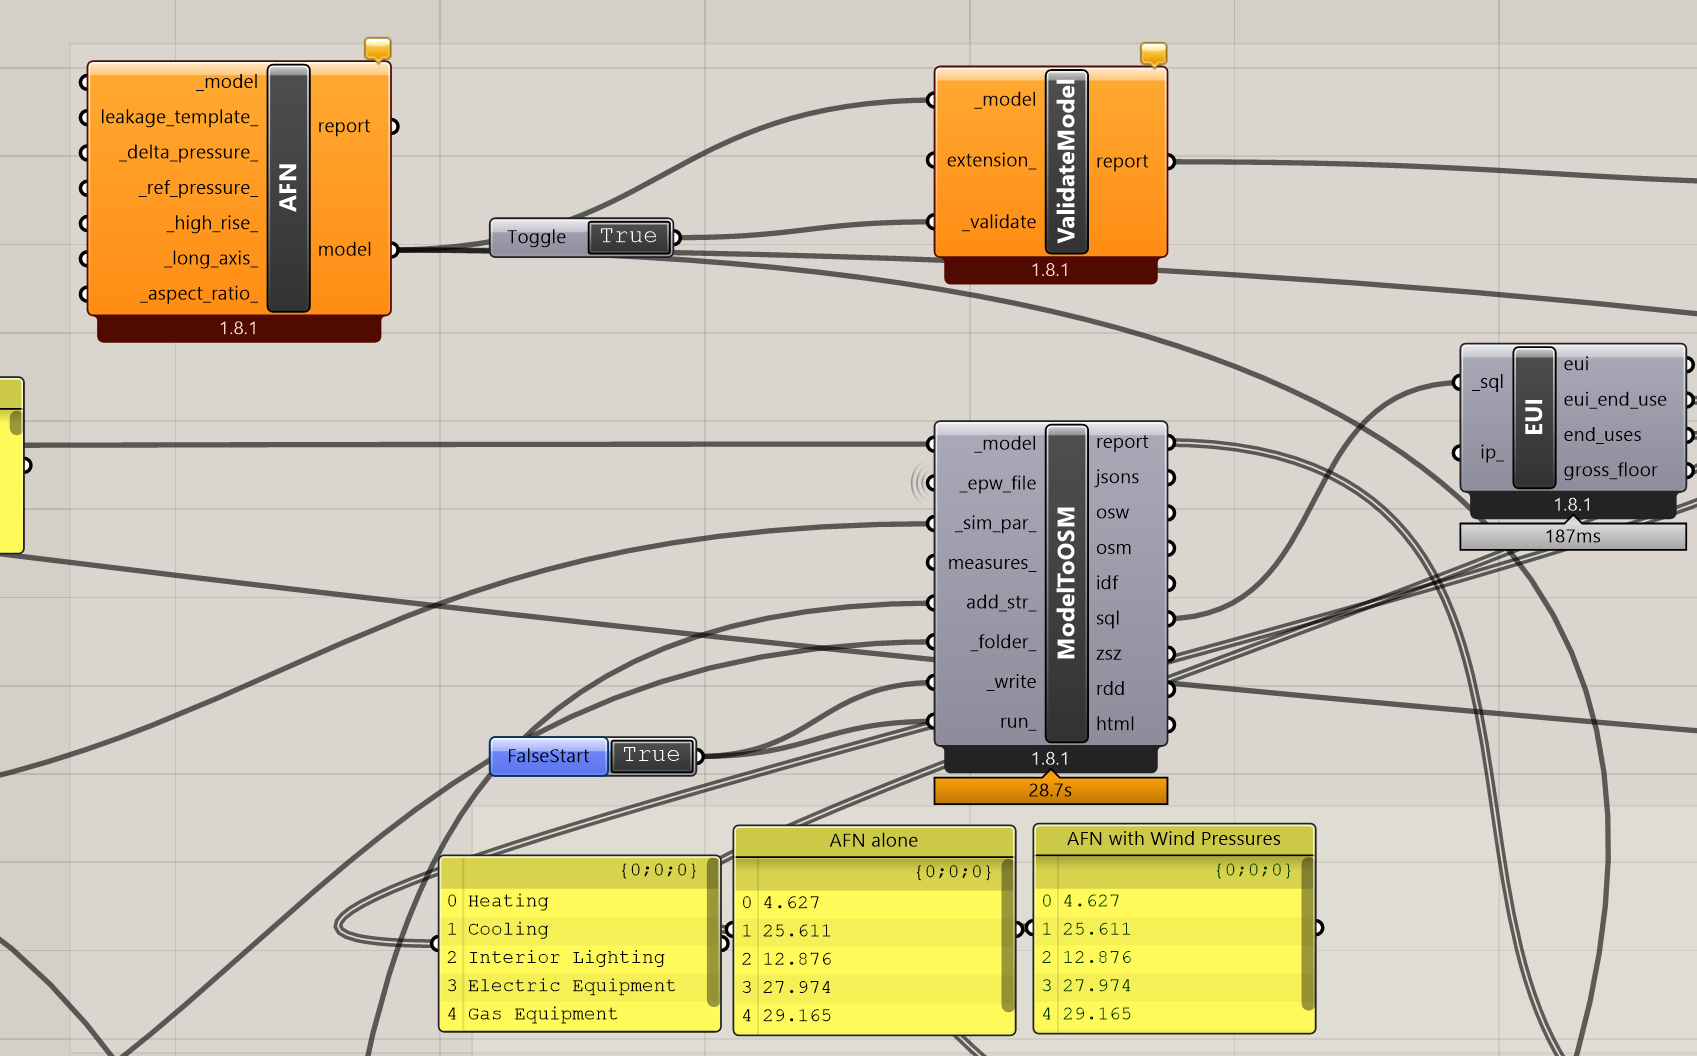
-
running the standard simulation as first set up in the workflow
-
stripping out the wind pressures from the WPC text string file but leaving in the rest of your AFN text strings and connecting these to the add string input of the Standard Simulation
-
disconnecting the AFN definition but leaving your WPC added string attached also with the Wind Pressure Coefficient data excluded for the Standard Simulation
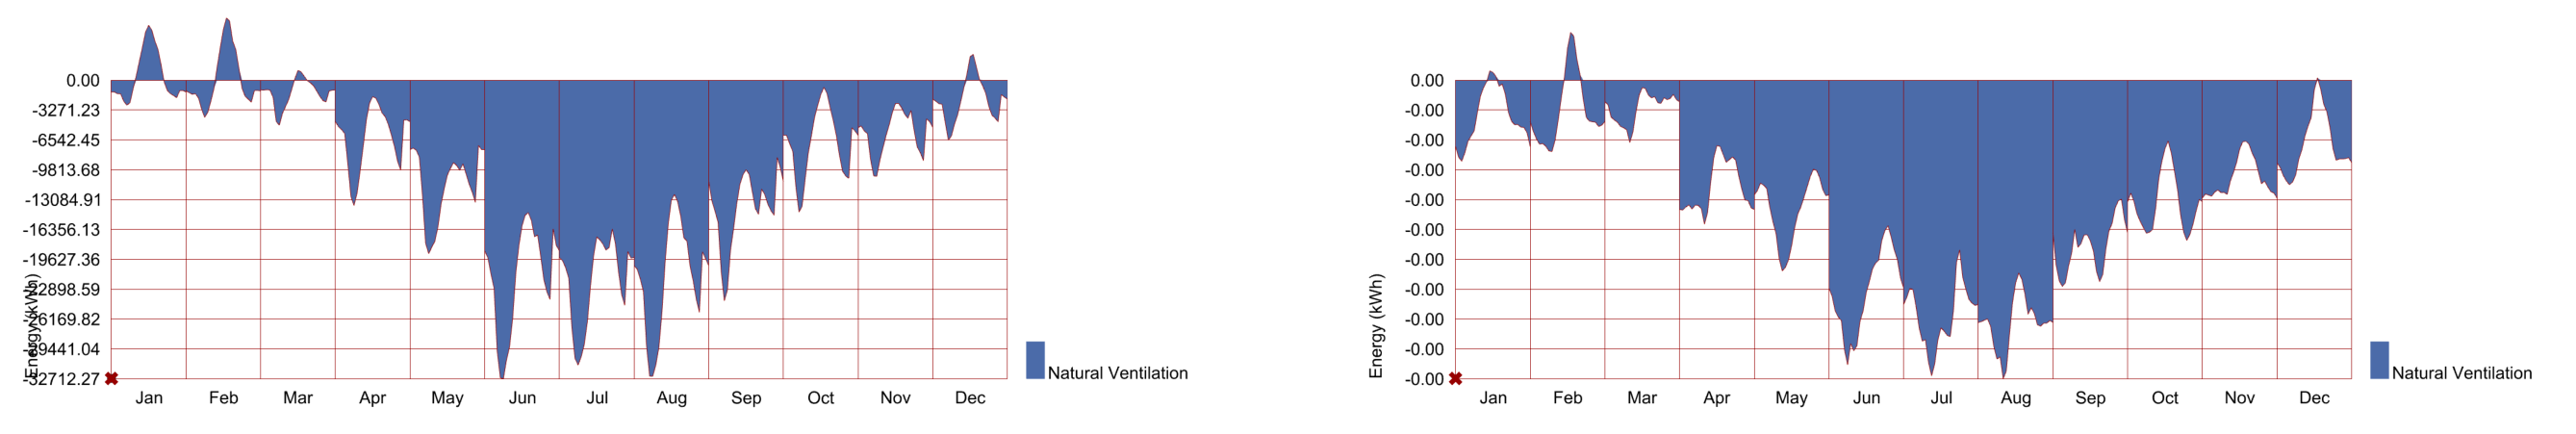
What is striking to me is that 4) is using all the setpoint settings that you described that should be different and the energy use index is still far bigger than for the version with your full wind pressure data accounted for. This still seems strange to me in that the HEATING energy is so different, and that this is not cured by the addition of your AirFlow Network definition without the associated Wind Pressures .
m