Announcement: Wind Pressure Coefficients-Integrated Building Energy Modeling Workflow Launched!

Kia ora

Yes, I understand how the Matrix of wind pressures works as an entry to EnergyPlus. I had a PhD student do this with Butterfly a few years back. My question was related to ensuring the process calculated as fast as possible, so I was asking whether there were any settings you knew of for this.

Now, in testing mode with your base file, I am working on a couple of issues:

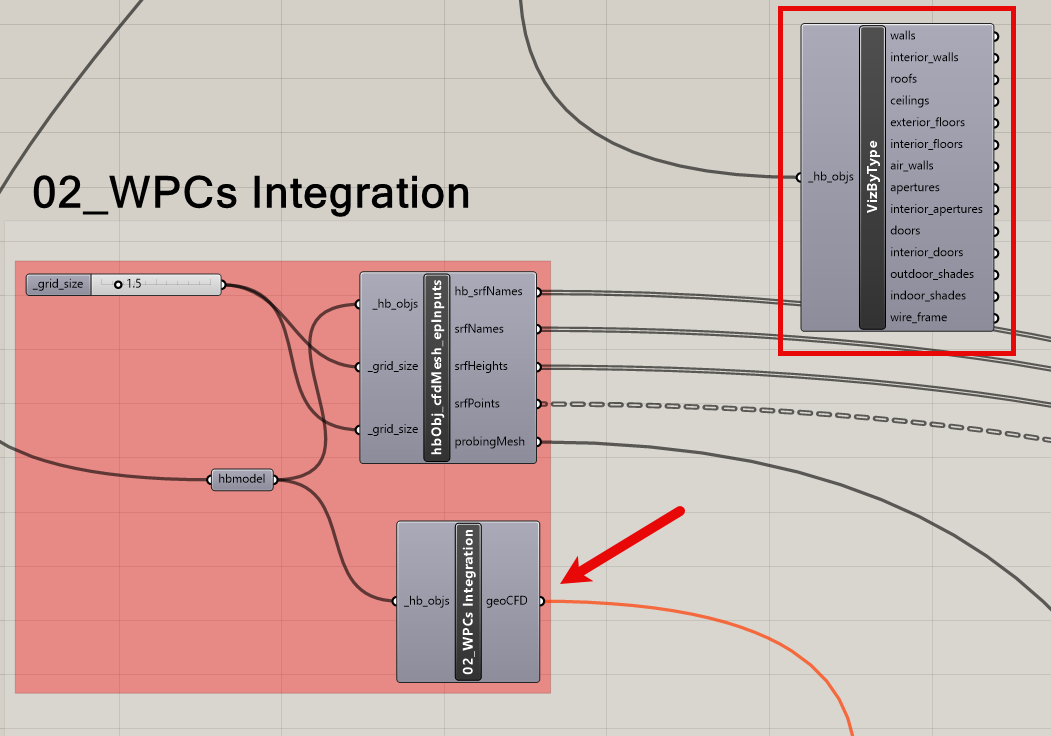
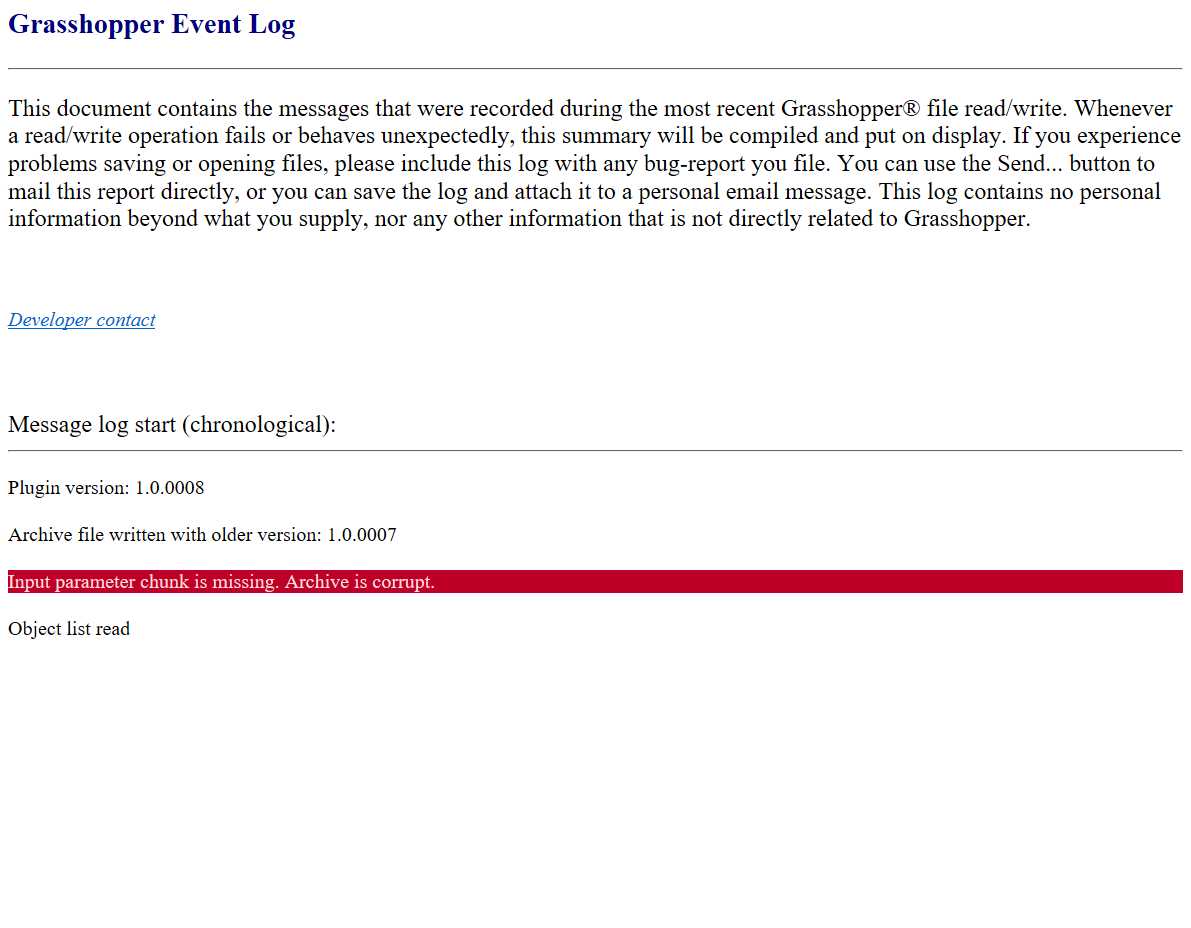
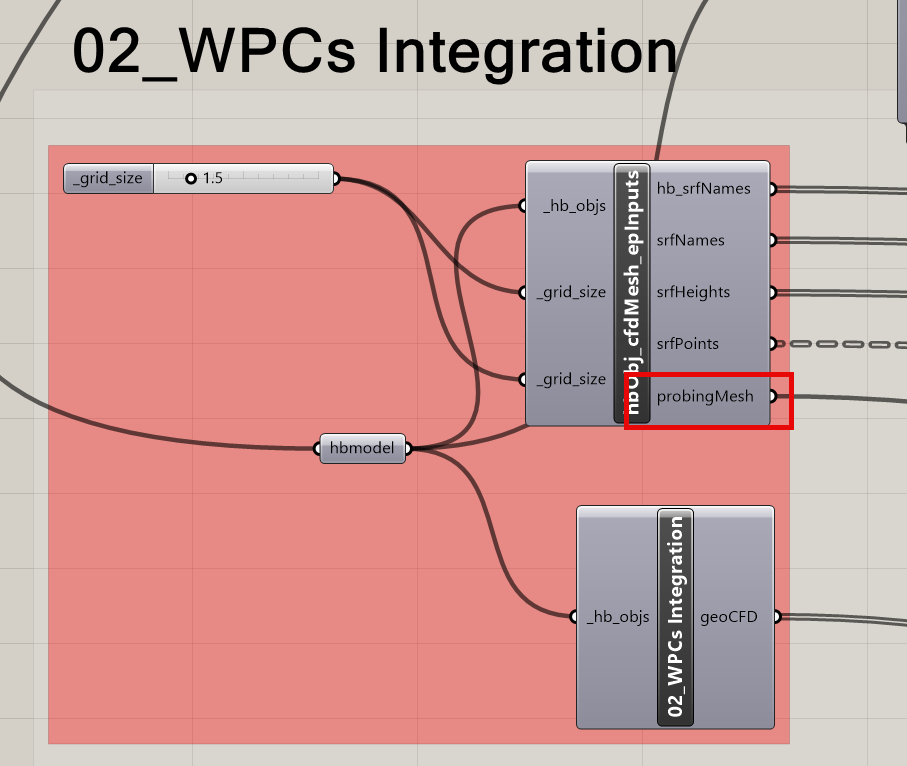
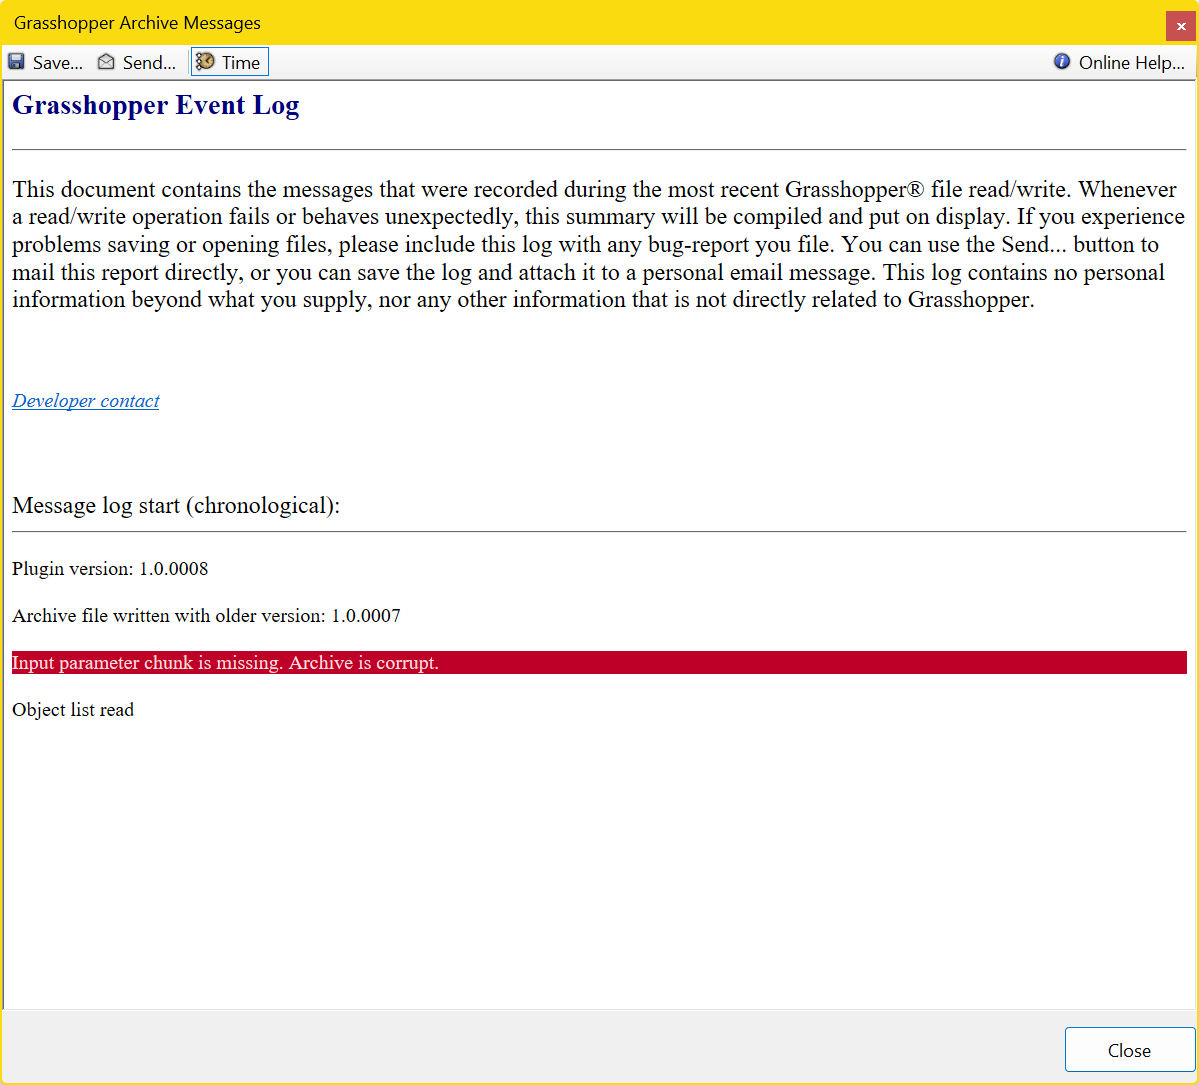
I can sync the LadyBugTools version on the LBT components - and I hope the sync happens inside the components. However, when I find an input that is legitimate, and an output that is in error for a cluster component, I have no means of debugging. I respect your desire to control the contents of these clusters, but am interested in your suggestion of how to address these issues (more than one component at present)

For example:
image

The above simplistic geometry stops here:


(I have put a box around the LBT component that produces the above visualisation of the model that is connected to the input to this cluster)

Can you please share ur GH file with geometry internalised?

Kia ora @Naga

Success!

I reverted to your original model.

That model did not have any context geometry. So I added Two blocks.

image

This may have been a result of this error message
image

This then was updated to match my current LBT installation 1.8.76 (running the Ladybug Sync operation)

AND

I replaced all the Eddy3D components with the latest 0.4.15.2 version one by one (I have left the older ones in place while testing

Then I was able to run the two EnergyPlus models (with and without AirFlow Network driven by wind pressures)

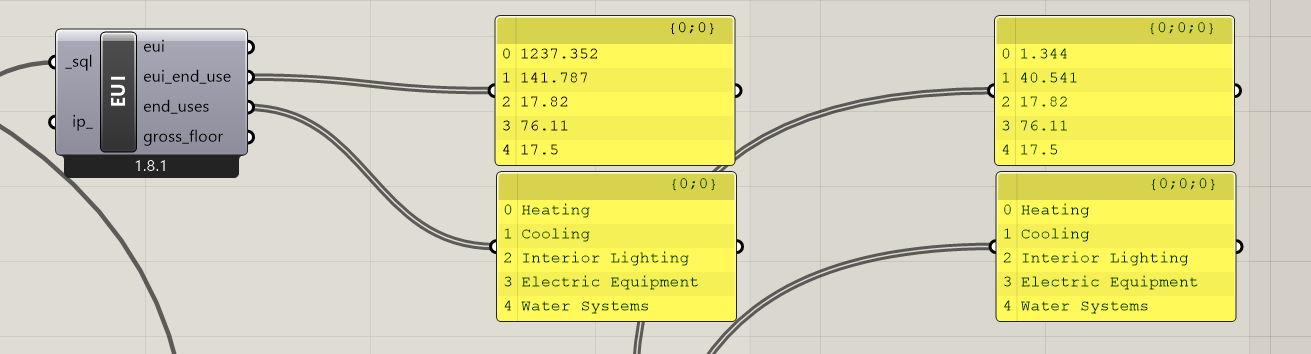
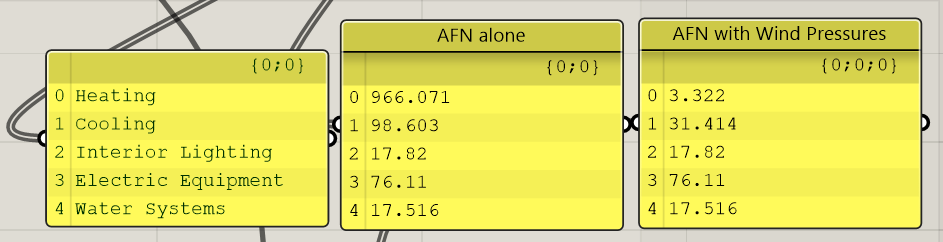
The right hand numbers are enhanced by the Wind Pressure Coefficients - why the heating EUI is lower there is a puzzle, but they ran! So now for the excitement of design exploration to explore this.

I attach the WIP of the updated file.

NOTE: I have here used your more complex building model in the gh file you distributed. I had in my original post incorporated a copy of what I had developed as the test of the Eddy3D template - trying to take baby steps from their simple blocks to what seemed your more complex demonstration.

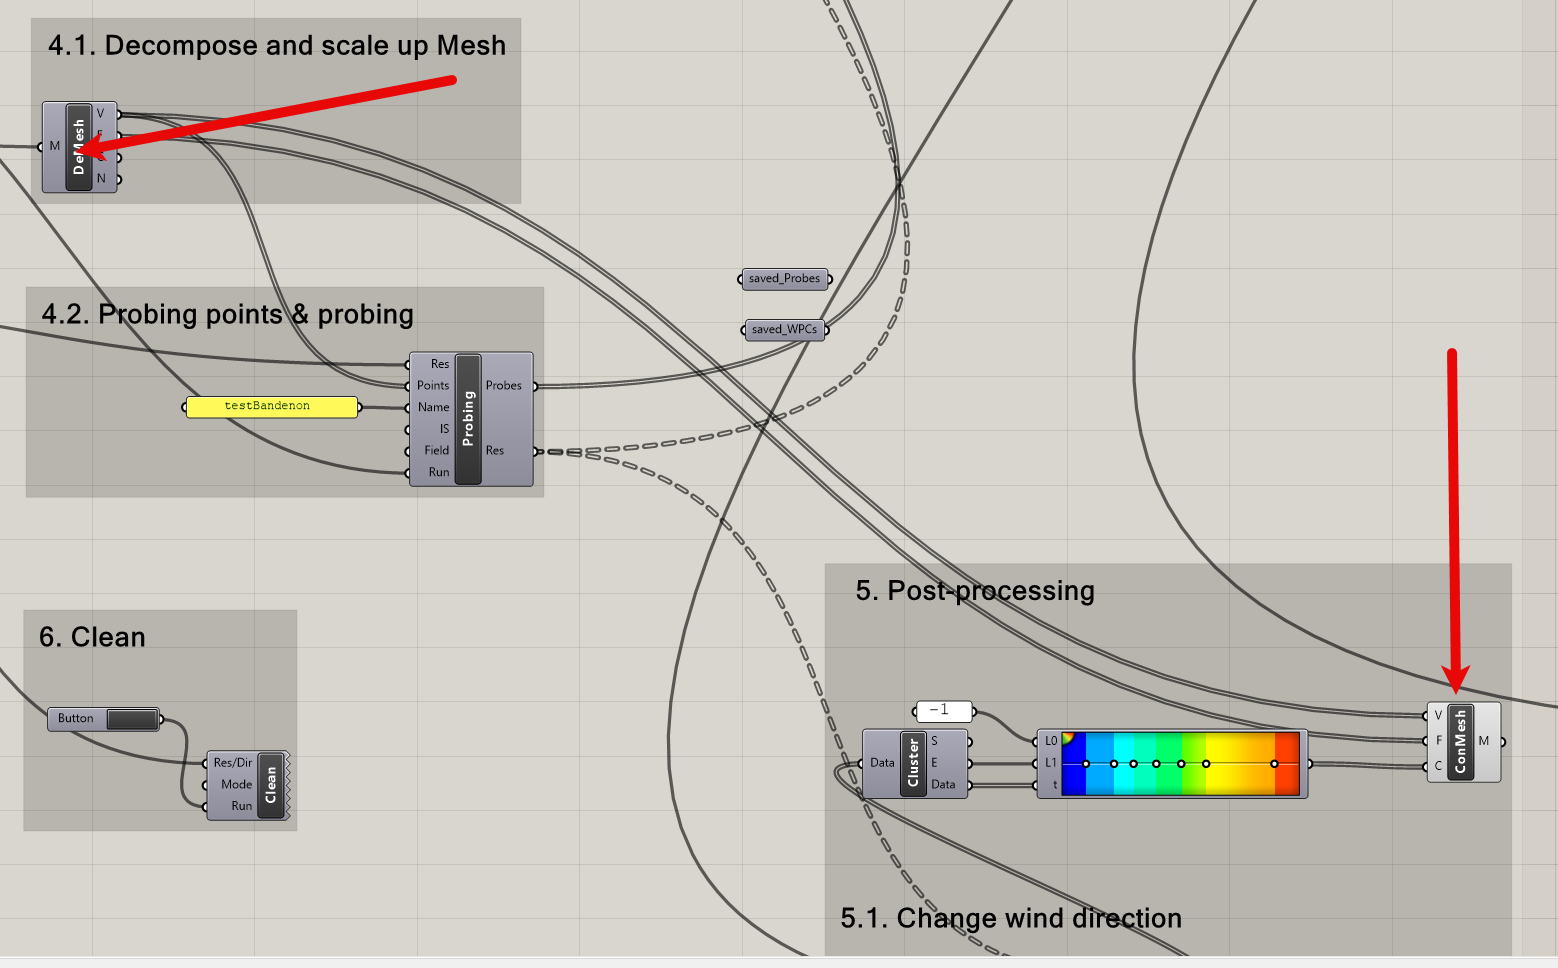
Next step is my own geometry / model. I do like the fact that - if the data is generated by CFD, it remains available for all subsequent E+ runs

Thank you so much for this.

workflow_v1.0_Eddy0-4-15-2_LBT-1-8-76.gh (488.4 KB)

2 Likes

@Naga - now I have sorted out the errors, I have TWO supplementary questions.

FIRST
I have created a basic 1 zone volume as the start of what will eventually be a multi-zone object.

As can be seen, the very long but not wide building is at an angle to the North (Green Y-axis) and East (red X-axis) grid.

image

When I view the wind pressures, I get this:
image

Which with the HB Energy model visualised, looks like this:
image

This does not seem right, and I assume it stems from this section of the Workflow:

My assumption arises from this demesh object connecting directly to the construct mesh coloured plot object.

SECOND
I cannot reconcile in my head the disparity in the results between your two models - each with an AirFlow Network implemented, but one having the wind pressures added as a supplementary text.

First, kudos for having both in the workflow you shared.
Second, with improved modelling of external airflow, why is the heating energy use /m2 reduced so drastically? Is there some other difference between the models built into the workflow that I am missing?

Please share your workflow.

Kia ora. I did. I am using the updated version of your workflow posted here Announcement: Wind Pressure Coefficients-Integrated Building Energy Modeling Workflow Launched! - #44 by MichaelDonn

But here it is again, with the two boxes (simplest geometry that I could generate as a test) internalised.

Thanks for the rapid follow up

M

workflow_v1.0_Eddy0-4-15-2_LBT-1-8-76_Angled.gh (487.6 KB)

1 Like

I will check and update you the issue ASAP.

By the way, @Asisnath, have you had experienced similar problem when you tested the workflow that you have updated?

No @Naga I didint have that issue

Kia ora @Naga

I would note, I have two questions:

  1. the odd behaviour of the graphics - and what that may signify about the relevance of the actual wind pressures calculated
  2. the addition of the accurate calculation of wind pressures massively decreasing the heating energy need of a building in a heating and cooling climate

M

I am sorry for the late response.
The moment I opened your workflow, I saw the Open Breps as inputs for both context and main building.

Usually, ladybug tool should warn about it like below. Yet, the GH file you shared is not showing it, which is weird.

However, I resolved the issue. In one of the components I used bounding box which is not good for angled buildings. I replaced that logic.

Please find the workflow with updated component.

workflow_v1.1_Eddy0-4-15-2_LBT-1-8-76_Angled.gh (513.5 KB)

For Rhino7 Users, I am uploading the revised version in GitHub.
workflow_v1.1.gh (493.4 KB)

2 Likes

Hi @Naga just to confirm , the above new GH file replaces the old script for angled as well as normal buildings right?

Yes @Asisnath. It works for building in any angle.

1 Like

Briliant - thanks.

I had assumed when talking to the students that is was probably a bounding box issue, as I had seen something like this in the past.

I have loaded the script to enable a class in a couple of hours time.

First thing to notice is this load error which I need to investigate:

Second, is that the cap the volume command in the script is no longer necessary?

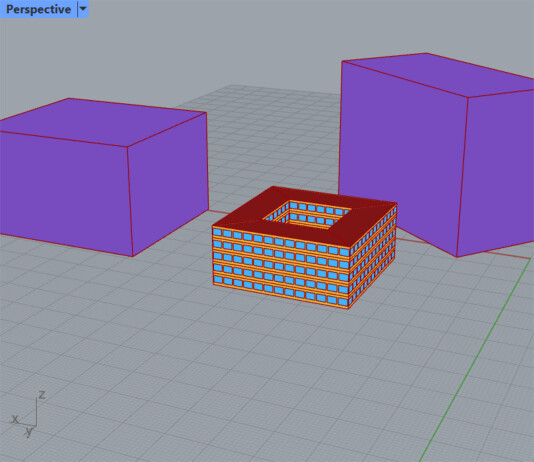
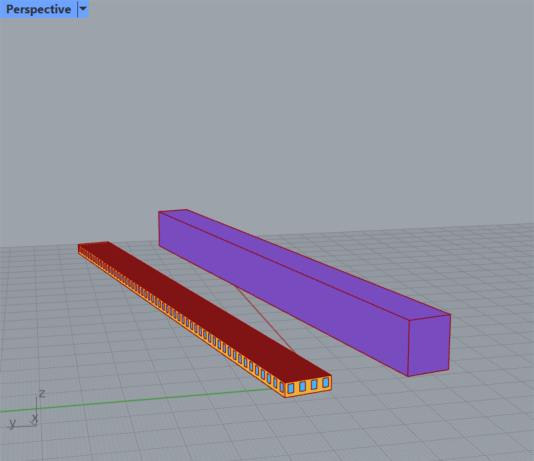
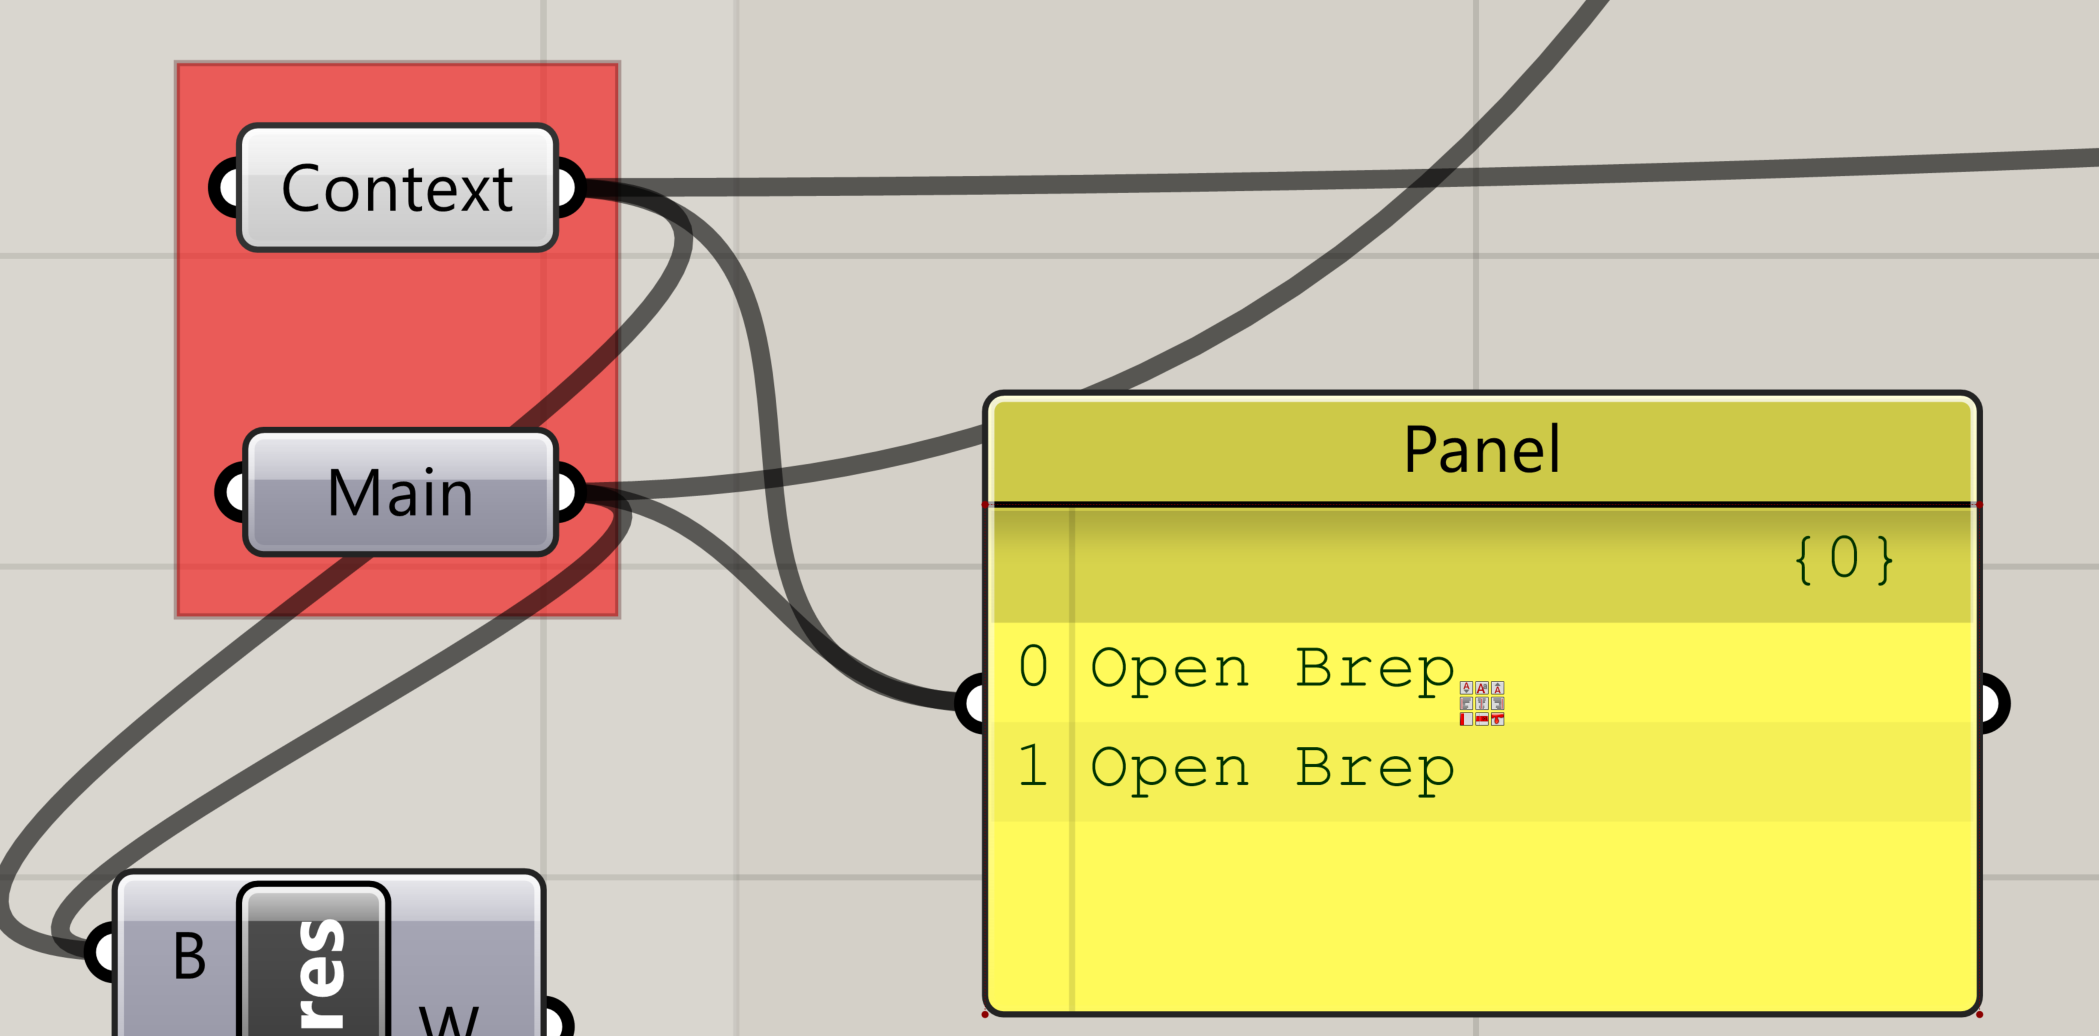
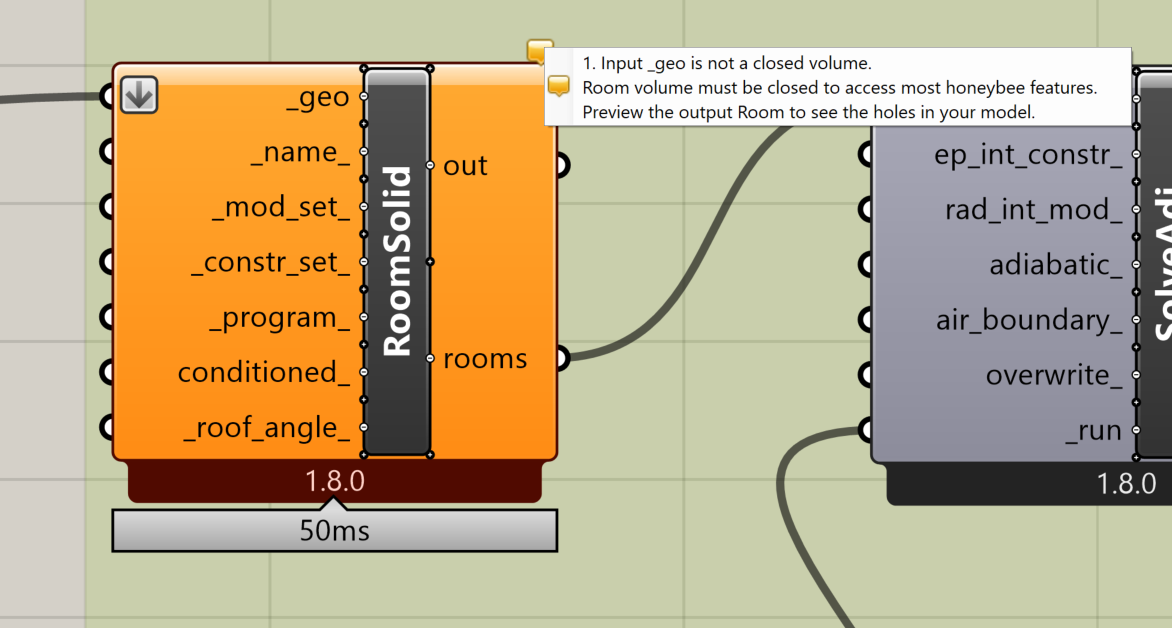
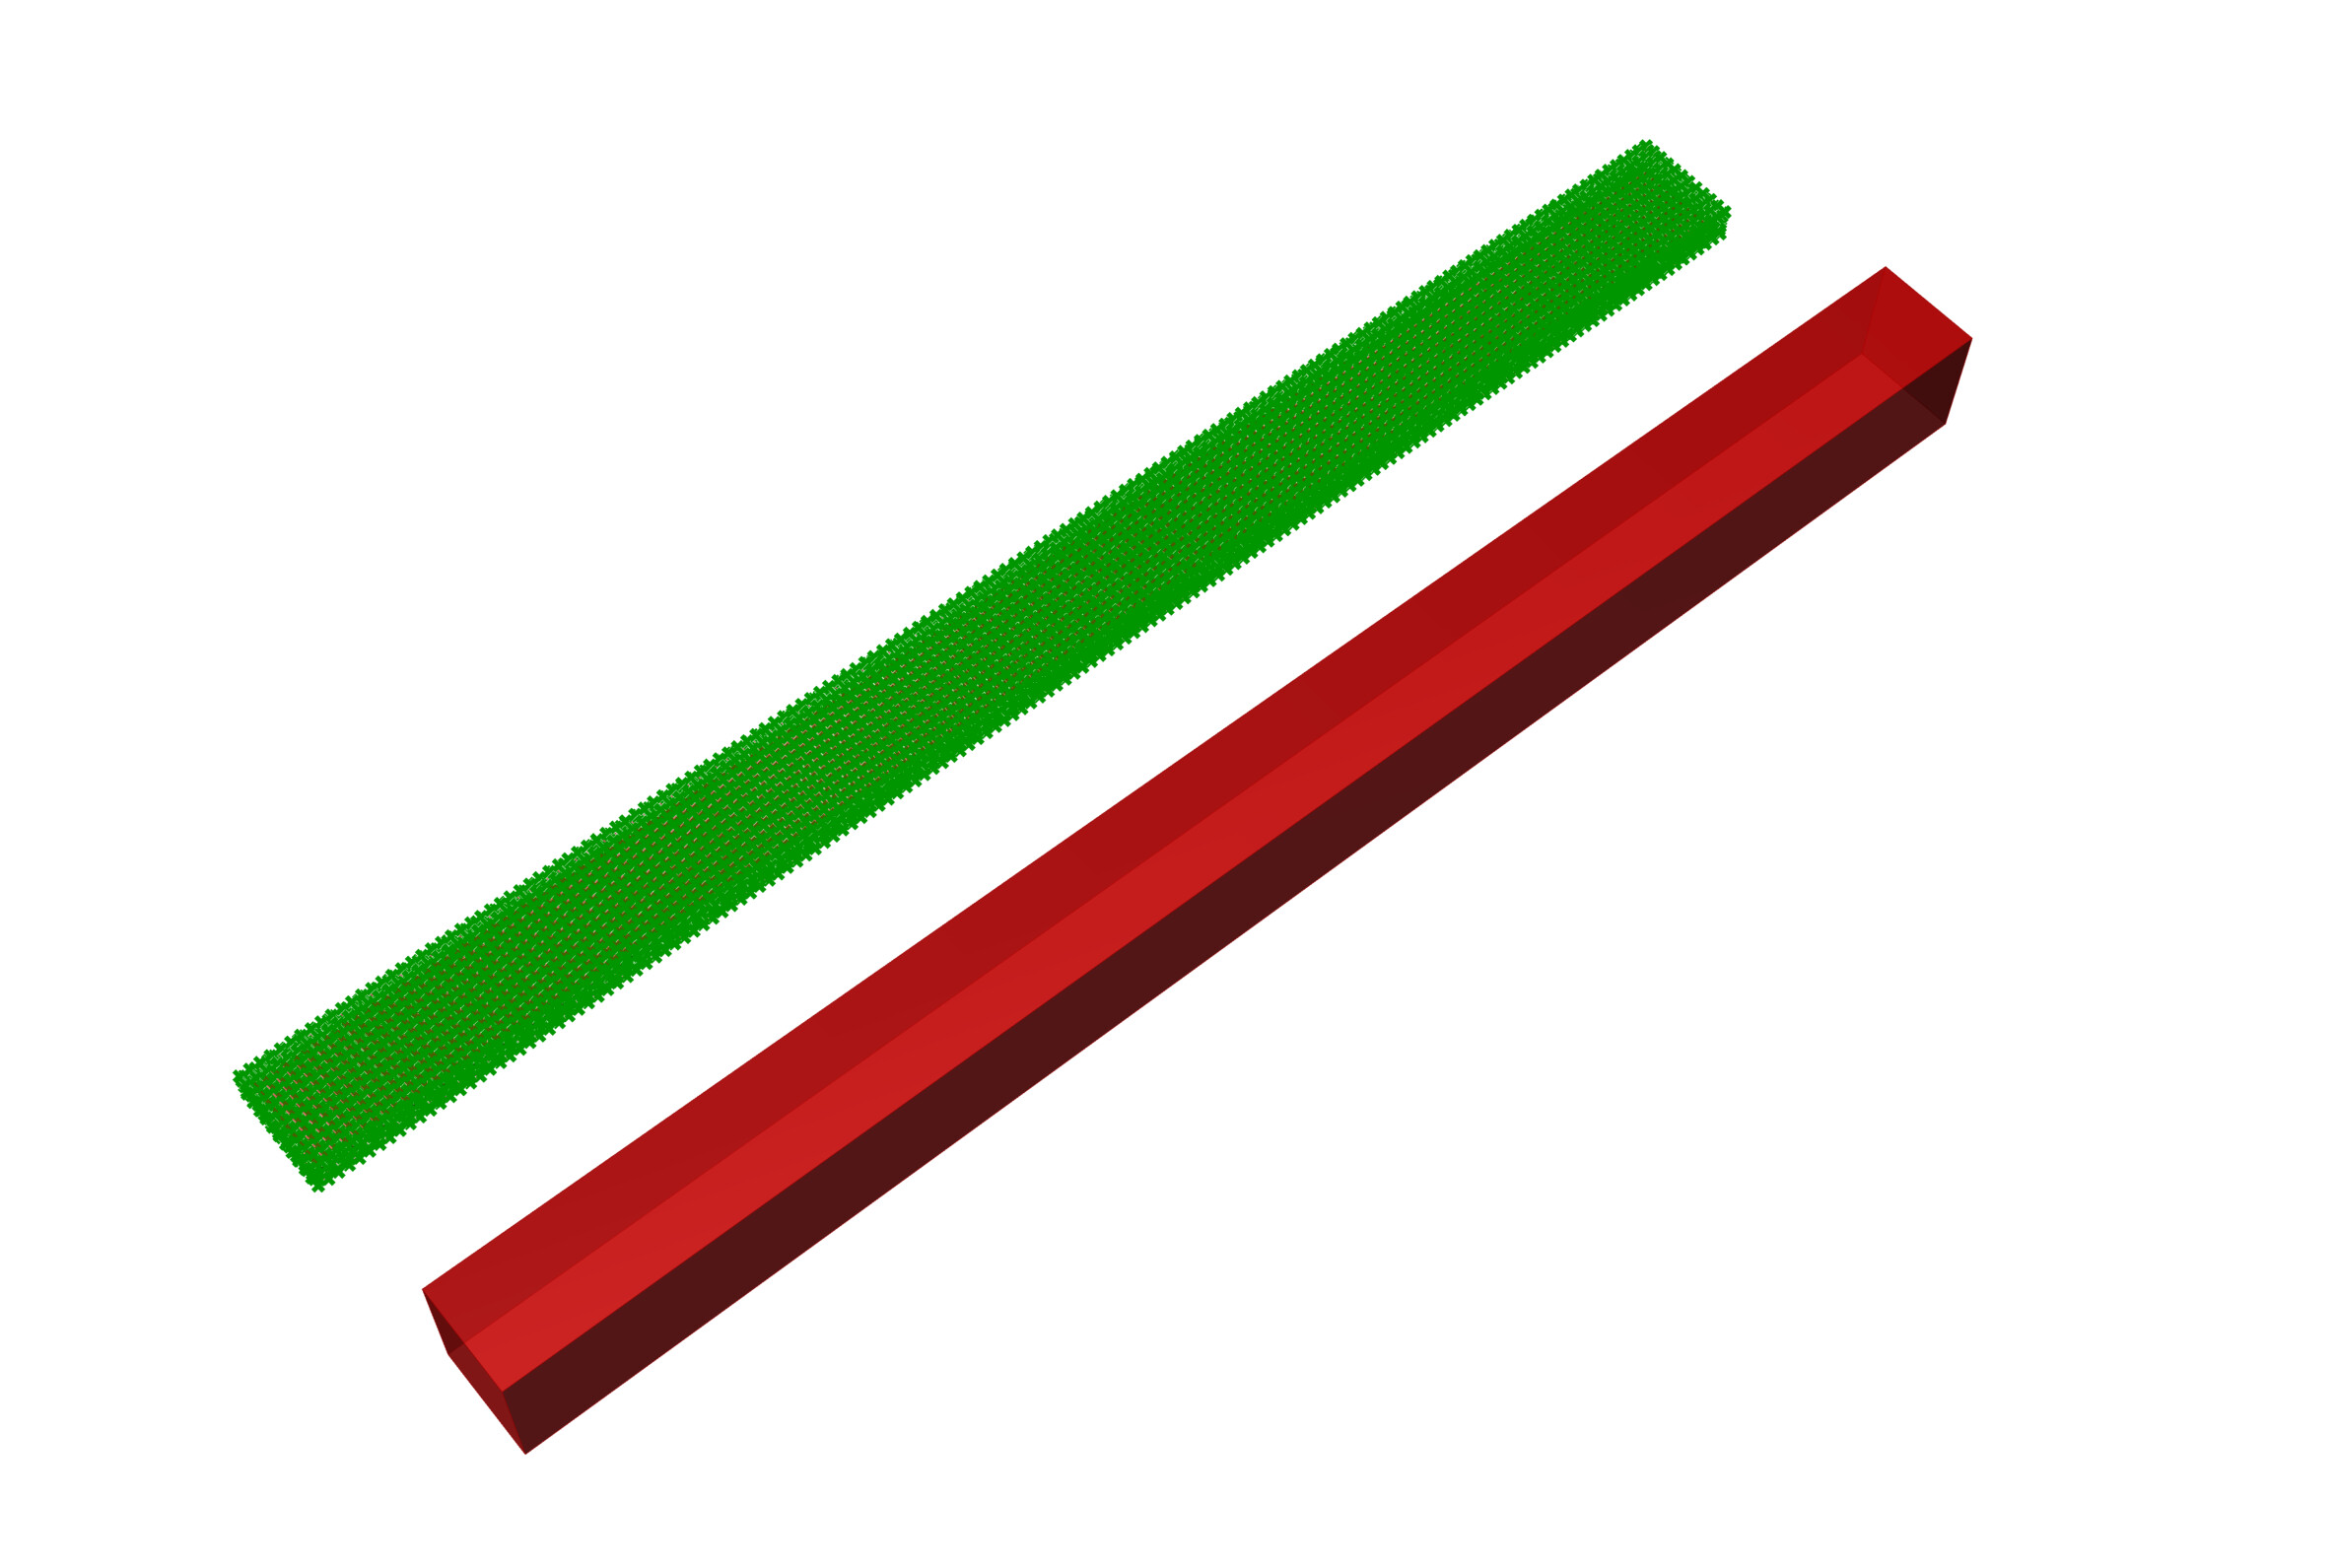
I had assumed that to model the shadows etc from the surroundings, I did not need to cap the volume of the context - but I take the point if that context is part of the CFD, then it should be solid?

m

I should probably add that this item turns up in the feed into the Energy Models:

image

I presume an issue with versions of Python

Yes, Michael.

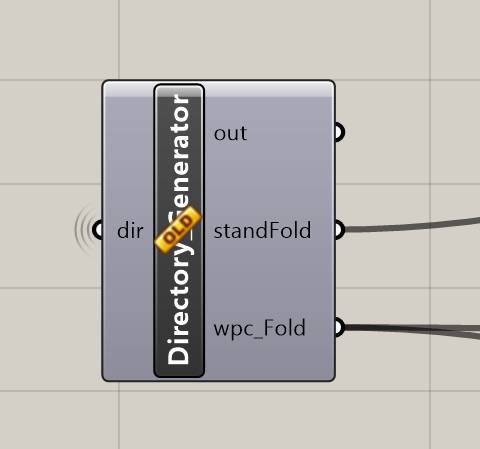
Since Morpho supports only Rhino 7 for now and my PhD extensively needs it, I am still using the older version.

In less than a year, with Gods grace, I am in a process of accomplishing my PhD.

This workflow is one of the very small test pieces in development of 3rd generation urban microclimate-integrated building energy modeling.

Once I reach the finish line, with permission of my Supervisor, I wish to make the components in this and future workflows as LB components with the help of Chris, Mostapha and other experts in LB community.

This can enable us to be resilient with version upgrade issues from Rhino.

2 Likes

Kia ora @Naga

Good luck with the thesis.

What you are working on will make an excellent addition to the LBT toolset.

In the meantime, I appreciate your generosity in sharing the workflow. Can you explain a little more the connection to the European COST Action on Positive Energy Districts (CA 19126) ? Is that part of the Quality Assurance / Calibration of the approach?

Finally, sorry to be such a pain, but I am still puzzled by the energy picture.

With just the Airflow Network modelled,

  • the HEATING energy use is 966kWh,

BUT with your workflow added, as far as I can tell to the same model, including the same Airflow Network driven by more realistic wind pressures,

  • the HEATING energy use drops to 3.322 -

  • a 99.7% drop from the original figure -

there is no basic physics reason I can think for this, so I assume something else is happening to change the AFN / model settings?

Is that the same geometry you shared with us earlier? Also please share epw file being used for energy simulation.

Kia ora

Thanks for getting back to me.

I got the same type of difference in heating energy performance using both your geometry, and my rotated geometry version.

It has taken me a while to figure out how to send the epw file. It is slightly too large for just attaching.

https://www.dropbox.com/scl/fi/64ic02siqebpu2w8qtj16/AUS_NSW.Nowra.RAN.Air.Station.947500_RMY.epw?rlkey=cyd8a7w2e99juv05rx5g6wi7k&st=awid2zqk&dl=0

Kia ora @Naga

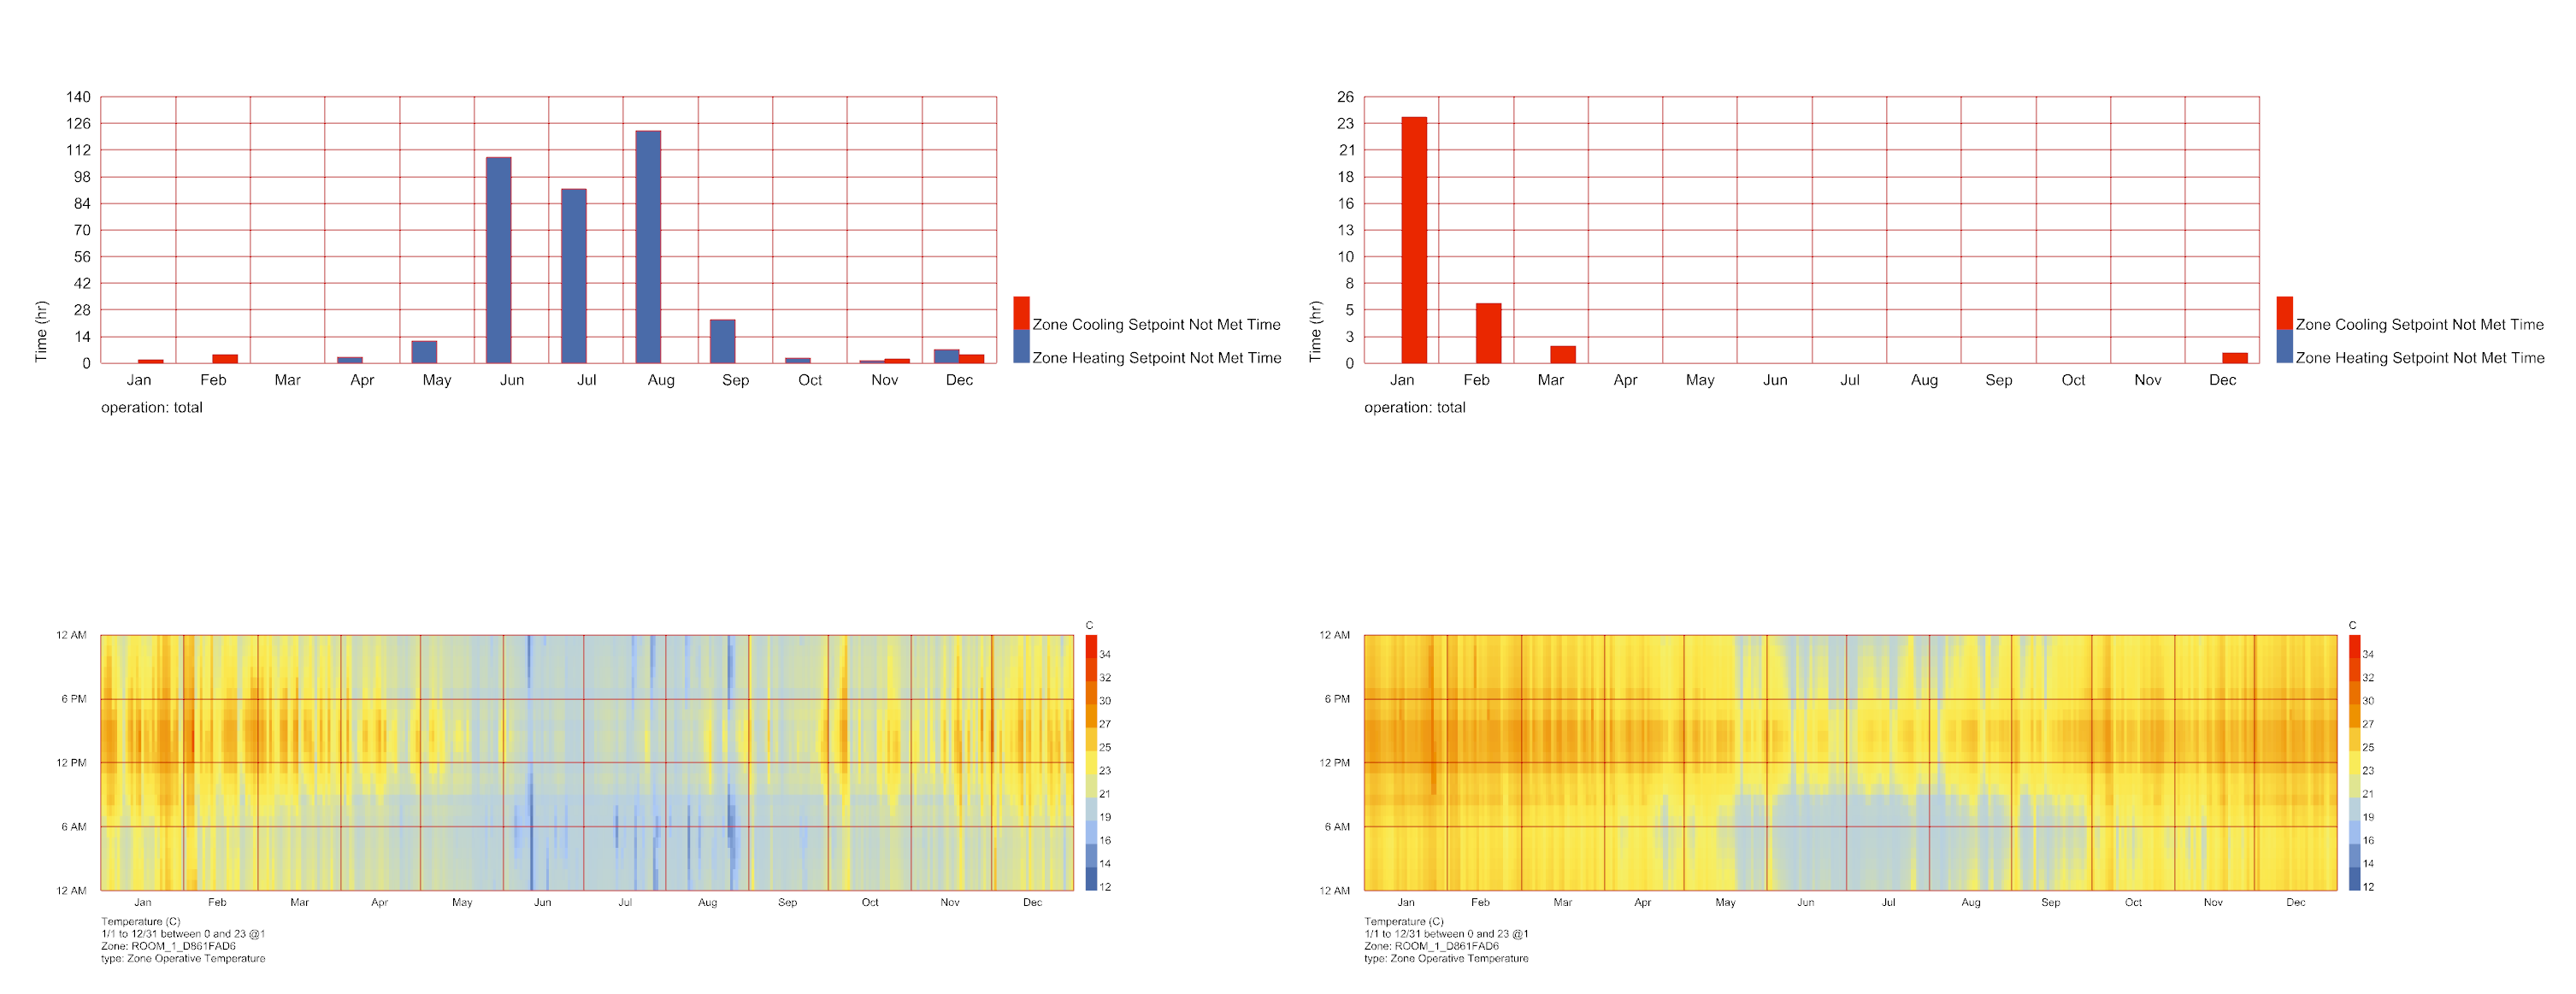
I feel almost apologetic about repeating my inquiry. However, I have just tried another option: plotting the internal temperatures and the amount of deviation above or below a couple of set points. Plotted on the following graph, the difference is striking. The graphs on the left are for the model with an Air Flow Network, but no wind driven ventilation using your Eddy3D results. The graphs on the right are for the exact same model, but with your additional text fed in from the Eddy3D calculations. Wind true wind driven ventilation the building is a lot warmer:

How can this be?

Sorry for the delay. I am a bit busy with my academic work. I will try my best to look into the issue again.