Annual Glare Analysis Fish Eye

@LaFleur
Hello, everyone.

DGP analysis based on images is set to Fish Eye for accurate analysis.

However, for annual DGP analysis, DSParameters uses views such as Perspective, Top, Right, and not FishEye.

So there is a difference between annual DGP and image-based DGP analysis, so is annual DGP analysis an inaccurate analysis?

Or is there a way to set the same as FishEye?

Thank you for your answers.

image
(image based simulation)


(Annual Analysis)

1 Like

Hi.

There is a difference between the hour-by-hour DGP calculation and the simplified annual DGP-calculation, based upon the vertical eye illuminance:

I recomend reading this: DYNAMIC DAYLIGHT GLARE EVALUATION (ibpsa.org)

1 Like

Dear @JaeWon.Kim,

First of all, you need to know that for the annual DGP simulation, DaySim is used as the calculation engine, while for the Point In Time analysis (Image-Based), Radiance and EvalGlare are used.
As specified by @EspenHansen, the annual simulation through Daysim is a simplified procedure and I can assure you that if you compare it with an image-based PIT analysis, you will have 2 very different results.
Some standards, such as the European one, accept the simplified method, but if in the same project you also have to illustrate a Fish-Eye image with the PIT results, it will be difficult to make the client understand why there is all that glare difference for a given month / day / time.
The solution would be to generate a PIT analysis for a whole year (using per example the colibri component) and extrapolate ONLY the glare value, through Evalglare, so to generate an annual chart, without to generate the 7860 images, which would be very time-expensive (based on the radiance parameters) and it would also take up a lot of memory. But here the Maestro is @mikkel. Maybe he has a better solution.

I hope I have helped you

2 Likes

Thanks for the kind words, @LaFleur.

I have never ventured into annual PIT renderings (8760 images). The longest time period has been one full month (744 images), but that was with matrix-based methods when I did some testing in relation to integration of the imagebased 3-phase method in HB[+]. Another option is the imagebased DC method, which is a more stable recipe in HB[+].

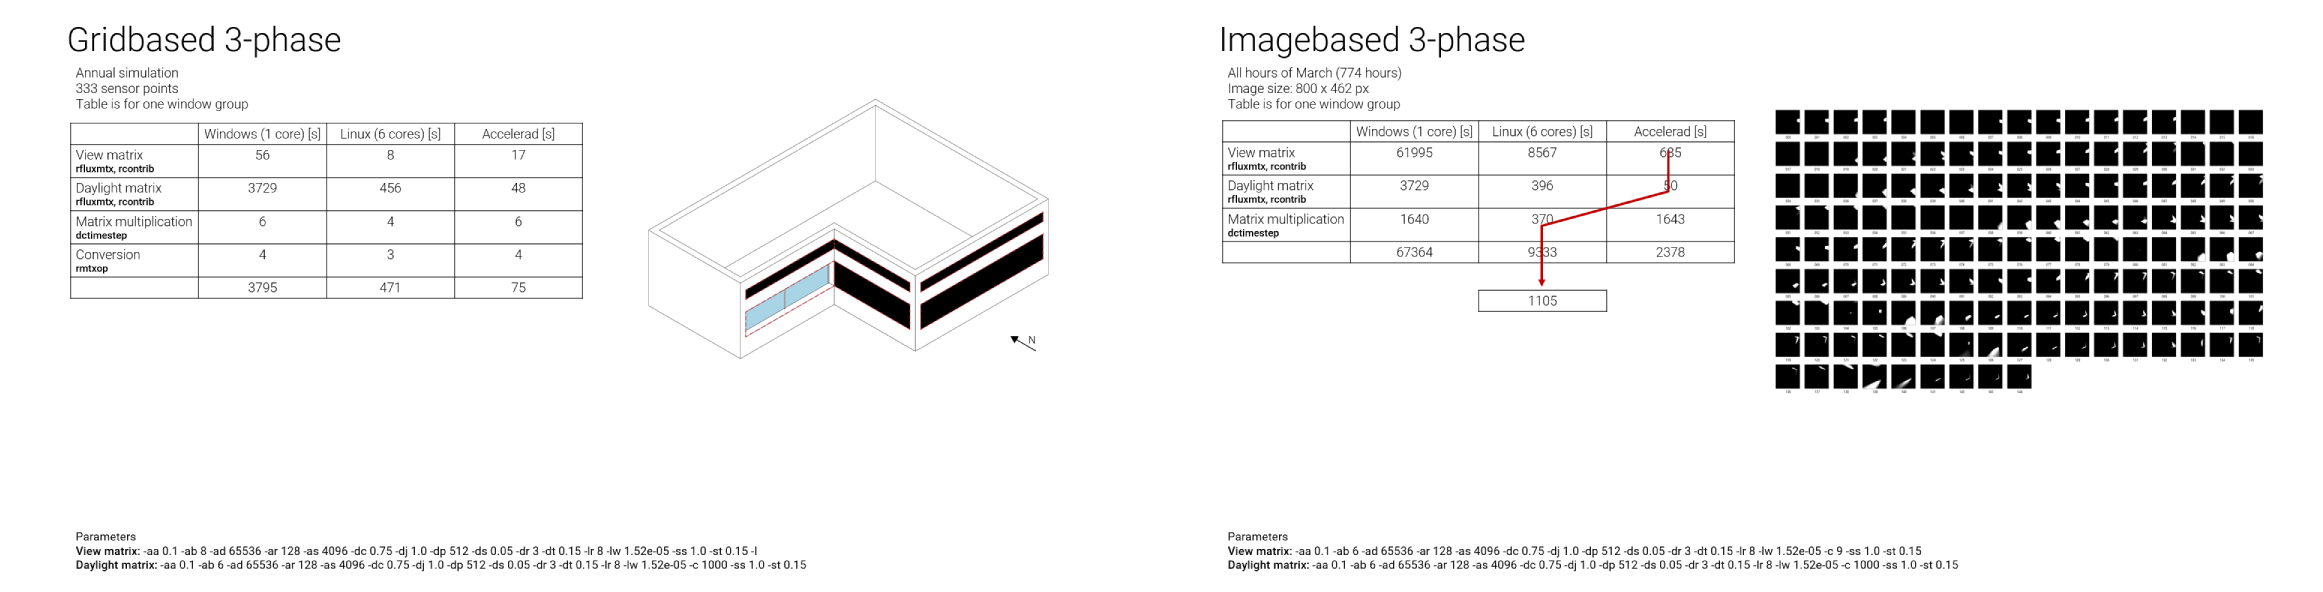
The obvious benefit of matrix-based methods is that you only have to do one simulation, and the rest is matrix multiplication to generate images for each hour. While that is great, I did experience that the matrix multiplication (dctimestep) is also a slow process. Multi-core is not possible for dctimestep by default, though running dctimestep in parallel is possible, but not part of Honeybee. During testing I also experienced that dctimestep is significantly slower on Windows compared to Linux - I used Windows Subsystem for Linux, so it was still on a Windows machine. The comparison is seen in the image below - note that the 6 cores for Linux is only for rcontrib and not dctimestep.

So to answer your query, I am not sure I have a better solution, but if I was forced to do 8760 renderings I would likely opt for matrix-based methods (HB[+]) rather than rpict (HB-Legacy). And as you mention it will take up a lot of memory. I currently only have a 256 GB hard drive - I wouldn’t even make it past January!!! :unamused:

2 Likes

Dear @mikkel, thanks for your time and for the preciuos explanation,

my idea was to bring out the DGP result of every single hour through the PIT analysis, group all the 8760 results and create an annual chart, without rendering the images. If later I want to create one or more example images, for a given month/day/hour, the result must be almost equal to the value in the chart (as you well know, almost will depend on the resolution of the Radiance parameters)
1-s2.0-S2352484720300627-gr12.

I have read the research “The Imageless Method for Spatial and Annual Glare Analysis” undertaken by Nathaniel Jones and your example into this post (Annual Daylight Glare Probability for multiple Test_points - #6 by mikkel) to replicate the research, but I didn’t have the right project to get to the bottom of the matter, but could this be the right method?

The DGP annual simulation (without Daysim), is a method that I would like to be able to perform sooner or later, when the new components in LBT are ready, but obviously the question of the renderings is a limit that I would like to overcome. This is why I wanted to ask for your advice.

Best regards

2 Likes

… but I didn’t have the right project to get to the bottom of the matter, but could this be the right method?

I guess the imageless glare method is perfect to create an annual chart. You just have to keep in mind which sky the analysis is performed with if you later want to compare imageless with a rendering. The annual imageless is climate-based using an epw file. You could also do it with a sky created by gensky, and then loop through every month, day, and hour - so essentially 8760 PIT imageless simulations. The imageless method will still be quick if you do it this way.

The DGP annual simulation (without Daysim), is a method

Just to be sure, are you thinking of the imageless method here?

Anyway, for fun I did - outside Grasshopper - some quick low quality renderings (-ab 3 -ad 1024 -as 512 -ar 128 -aa 0.3 -lw 0.005) for different hours of the year and found the DGP, and compared them with imageless DGP. It is nice to see some similarity between my graph and Nathaniel’s comparisons.

@EspenHansen @LaFleur @mikkel

Thank you for your kind reply. It helped me understand a lot!

If you don’t mind, I’d like to ask you one more question.

Is there a clear standard for setting RAD Parameters?
(ex, ab, ad, as, ar, aa)
There is confusion because the standards are different wherever I look.

Hi.

I recommend looking at this for a start:

SETTING RENDERING OPTIONS (lbl.gov)

If you want to adjust the standard Rad.values in the LB “Rad.parameters”, I recommend looking at this post: Additional Radiance Parameters - grasshopper / honeybee-legacy - Ladybug Tools | Forum

I guess a trade off in terms of accuracy and computational time would be something like this:

Rad_parameters

There is confusion because the standards are different wherever I look.

Remember that the parameters very much depend on your specific model. The first link @EspenHansen mentioned is very useful, I believe, because it also provides information on how the parameters affect the simulation time. Furtherwore I would suggest you look at Chapter 6: Daylight Simulation in Rendering with Radiance, at least section “6.9.1 Ambient Calculation Parameter Values”. For the settings of ar and aa, look at equation 6.12.

@LaFleur @mikkel
Hello, I’m learning a lot from your past answers.

I’m sorry to keep asking you questions because there are many things I don’t know.

I wanted to use the above-mentioned " The Imageless Method for Spatial and Annual Glare Analysis" as a good method.

There seems to be no error until I run the simulation, but But the data doesn’t seem to have been generated.


And I don’t know how to read the file or create a chart.
So I post it here to find a problem with my file.

imagelessGlare_Test.gh (514.1 KB)

Could you leave a file or leave an answer?
image
(To look at the data)

I’m sorry to keep leaving questions and thank you for your reply.

Hi @JaeWon.Kim,

To clarify, do you wish to create an annual chart (like your image) for a given view?
If so, you have to do that manually as I did not add any options to visualize the results. Below you will see how the dgp file should look if generated. To visualize as an annual chart, you will have to extract the rows manually, and put the data into for example Ladybug’s 3D Chart.

Anyway, in _occupancy you must input an occupancy file. You can generate one like this, for example:

If this change does not create the data, I am not sure what is causing it.

@mikkel

Thank you for your kind reply.

First of all, I understood using the Occurrence.file and Note Pad. Thank you.

However, the file is still not created properly.

Can I know the cause by looking at this picture?


(No data generated)

Thank you for thinking about this problem together.

Your image does not reveal anything wrong. Can you please upload the project folder or share it somewhere else?

EDIT: Since it does generate the data, I am wondering if you do not have dcglare in your Radiance\bin folder. Make sure you have Radiance 5.3 or newer installed.

@mikkel

As Mr. Mikkel advised, the problem was solved. Thank you.

But there was another serious problem.

We put the same input into “The Imageless Method for Spatial and Annual Glare Analysis” and simulate it five times, and the results change every time.

Is it because there are variables about probability in the calculation process?

One additional question is, isn’t the reflectance of the object reflected in the calculation process?

I’m waiting for your answer. Thank you.

@Nathaniel
I see your posting about this and leave a tag to see if I can get any help. Thank you.
[HB+]Annual DGP simulation test.gh (532.4 KB)
Annual DGP simulation test result.xlsx (859.9 KB)

When you simulate with Radiance, you will never have the same results between one simulation and another.
You have to calculate that you can always have a 5-10% swing.
But from experience, I can tell you that if you use fairly accurate Radiance parameters, you can narrow the difference in results between the simulations.
The more accurate the parameters are, the more accurate the resolution will be and the time for each simulation will be far greater.
But from what I see from your graph, line 1 apart, it looks like a good result.

1 Like

failed to import honeybee
Hi, thanks so much for the GH script. However, I got an error ‘failed to import honeybee’ for the imageless glare recipe component. The other components worked fine. Would like to check if it can run on Rhino 7? thanks!