Dear @mikkel, thanks for your time and for the preciuos explanation,
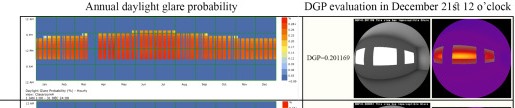
my idea was to bring out the DGP result of every single hour through the PIT analysis, group all the 8760 results and create an annual chart, without rendering the images. If later I want to create one or more example images, for a given month/day/hour, the result must be almost equal to the value in the chart (as you well know, almost will depend on the resolution of the Radiance parameters)
 .
.
I have read the research “The Imageless Method for Spatial and Annual Glare Analysis” undertaken by Nathaniel Jones and your example into this post (Annual Daylight Glare Probability for multiple Test_points - #6 by mikkel) to replicate the research, but I didn’t have the right project to get to the bottom of the matter, but could this be the right method?
The DGP annual simulation (without Daysim), is a method that I would like to be able to perform sooner or later, when the new components in LBT are ready, but obviously the question of the renderings is a limit that I would like to overcome. This is why I wanted to ask for your advice.
Best regards