Balance Chart - Heat Gain/stored Inquiry

Hello -

I am comparing two wall systems for a climate zone in Texas. I was expecting a lot of heat gains in the opaque surfaces during summer. However, I am seeing always the opaque loads in the negative side of the chart (where the energy loos is).
Can anyone provide some context as of why this might be happening?

See below for more context:
Mass wall above, wood construction below. It makes sense that mass wall has more energy storage, but this graph makes it look as there is no heat gain during winter.

Script

Thanks in advance,

Hi @Yure - can you share an image of the monthly plot that shows the axis and legend labels?

Hey @charlie.brooker. Please see below:


Hi @Yure,

I think I’ll need more context to understand what’s happening here. Adding the other load balance items (heating, cooling, etc) will help for context.

Is your space/spaces conditioned?

What does your geometry look like?

What’s the U-value of you constructions?

The window conduction seems to be behaving somewhat as expected, so I assume that your internal temperature is something reasonable.

Looking at avg high and low temperature for Texas it seems in peak summer it’s between 25-35degC. Doesn’t strike me as any opportunity for cooling from thermal mass, so unless your constructions have high mass and you’re running a low cooling set point overnight I can’t see that contributing.

My best guess from what you’ve shared is that the model you’re showing this for is adjacent to something much cooler - maybe the room adjacent has a much lower cooling set point. Or a big stretch the ground temperature is surprisingly low and you have a relatively large floor surface.

19 kBtu/ft2 is 59 kWh/m2 seems fairly realistic, but I don’t have a particularly good feel for EUI.

Hi @Yure, thanks for sending across your model and script in a private message.

As far as I can see the results are “correct” as far as there’s no bugs happening in the LBT code.

Getting into the details of the results was a bit tricky due to the way LBT and E+ combined handle solar gain and external conduction (face_energy_flow includes solar gain, which LoadBalance then separates out into another variable).

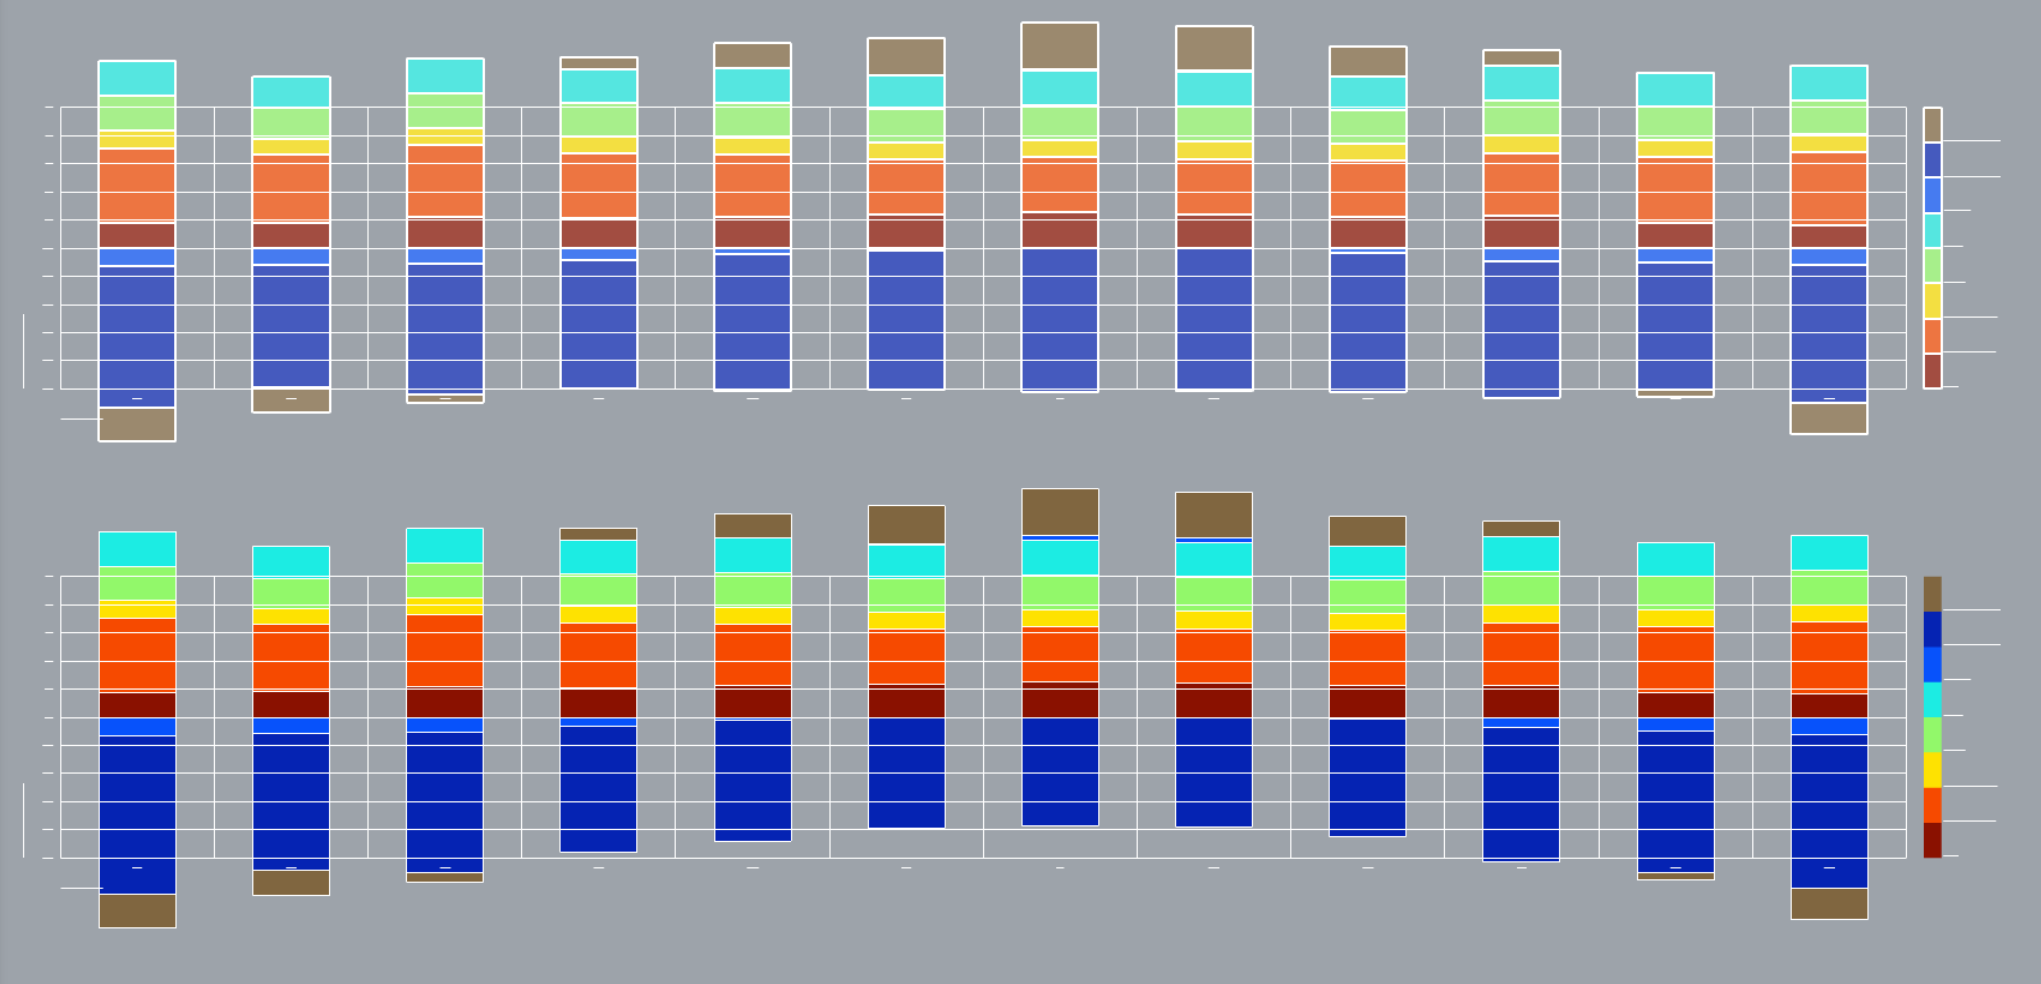
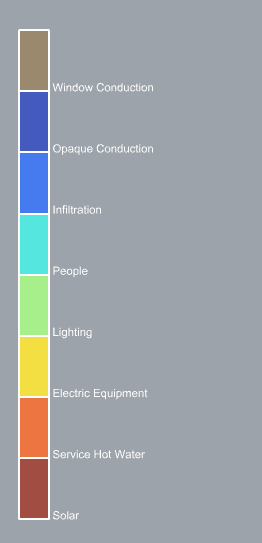
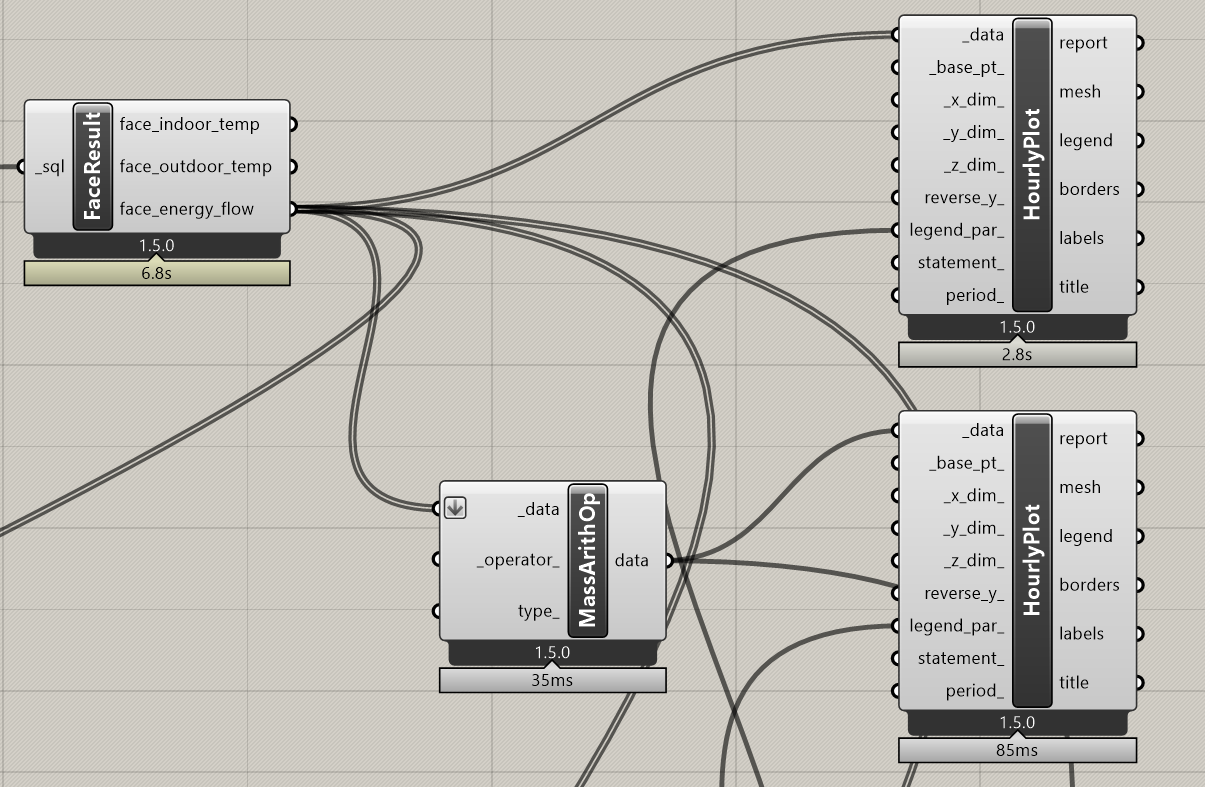
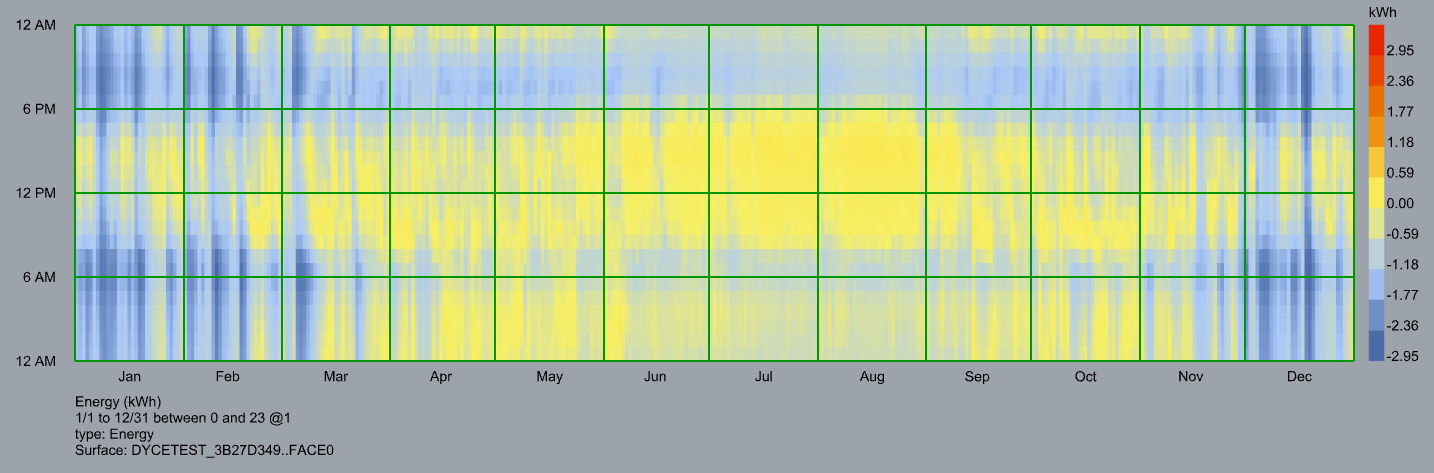
Visualising the face_energy_flow like this

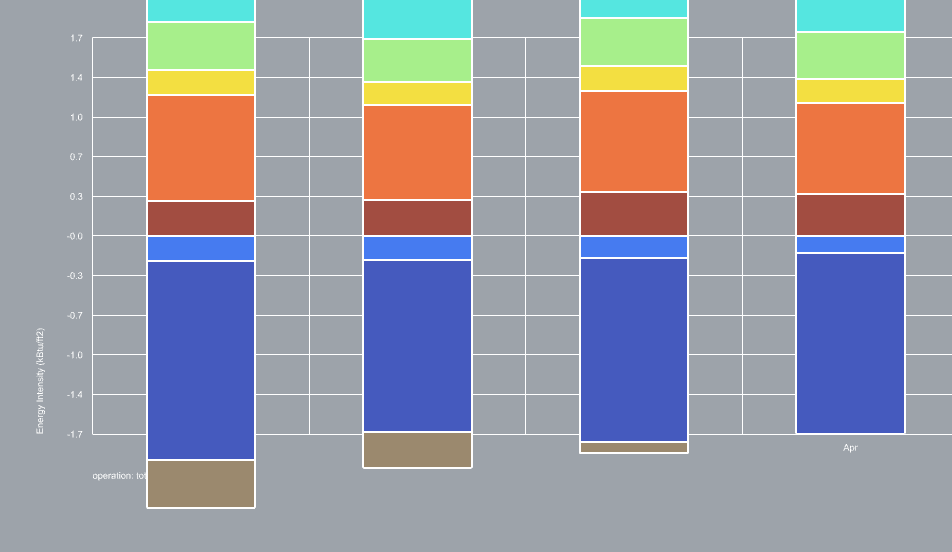
And setting the legend parameters so that they are consistent for all plots, the summed result for face_energy_flow looks like this - even with this including solar gain, the overall energy flow through the fabric is pretty much never positive (or at least not significantly positive)

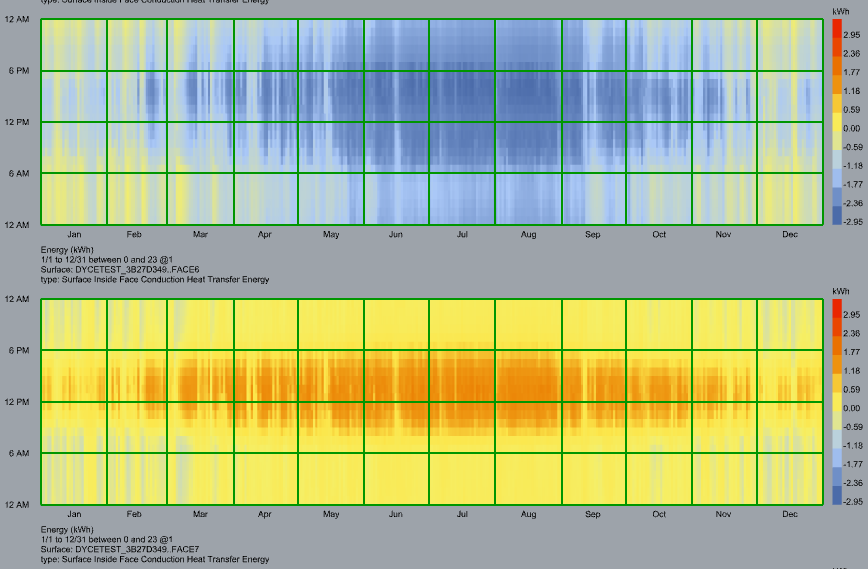
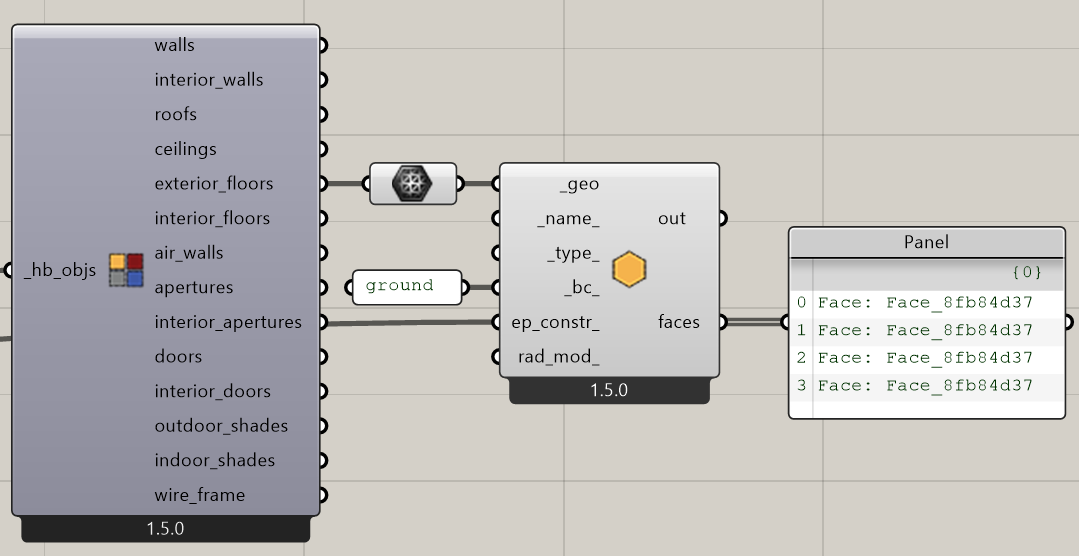
Looking at the individual plots the two with significant results are the roof and floor (I checked which face was which using LabelFaces, top is floor bottom is roof). The floor is providing significant cooling, more so than the roof is heating.

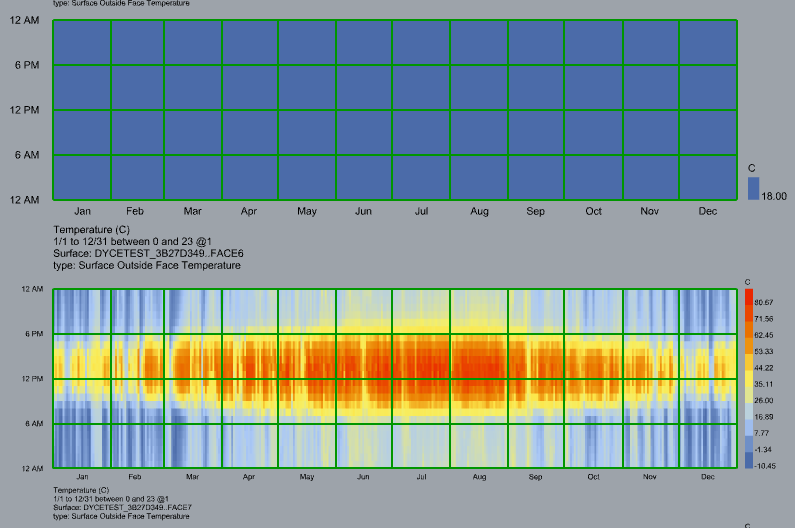
The external temperatures of these surfaces look like this

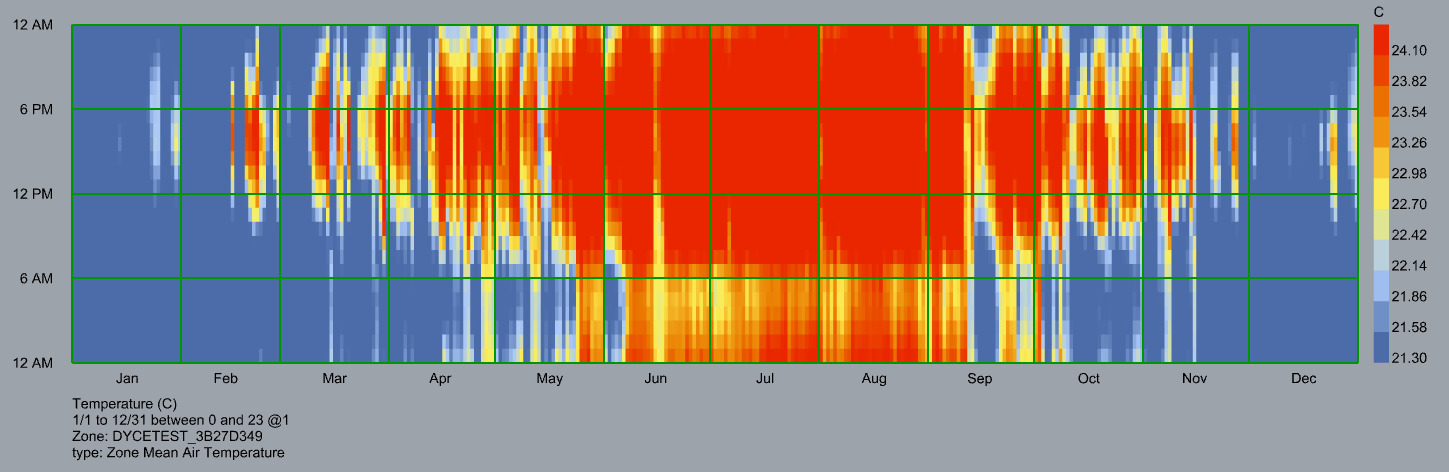
With the adjacent condition of the floor at 18degC consistently and the space consistently above 21.3 (and going up to 24.1, space temps below) this cooling makes sense.

The question is then is the setup giving accurate results…

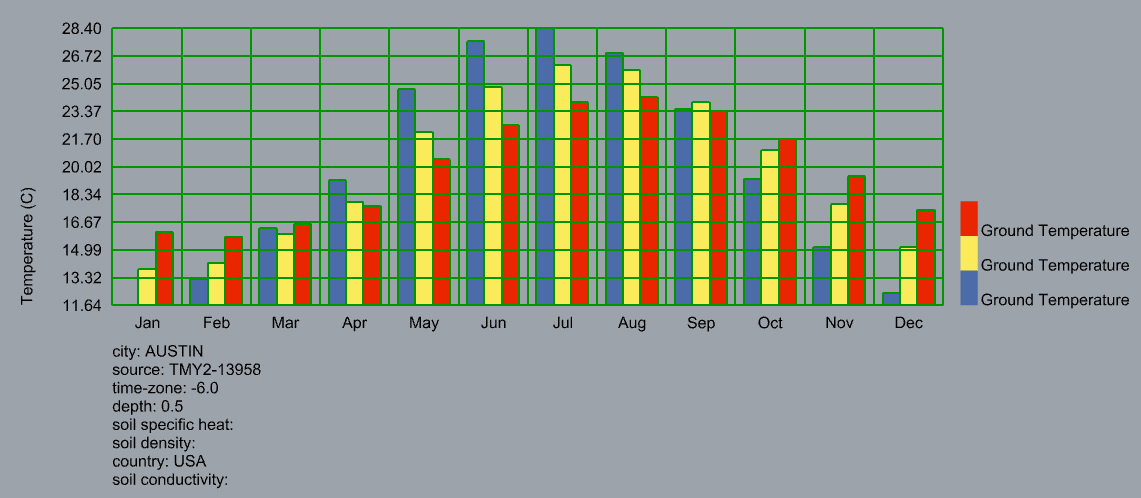
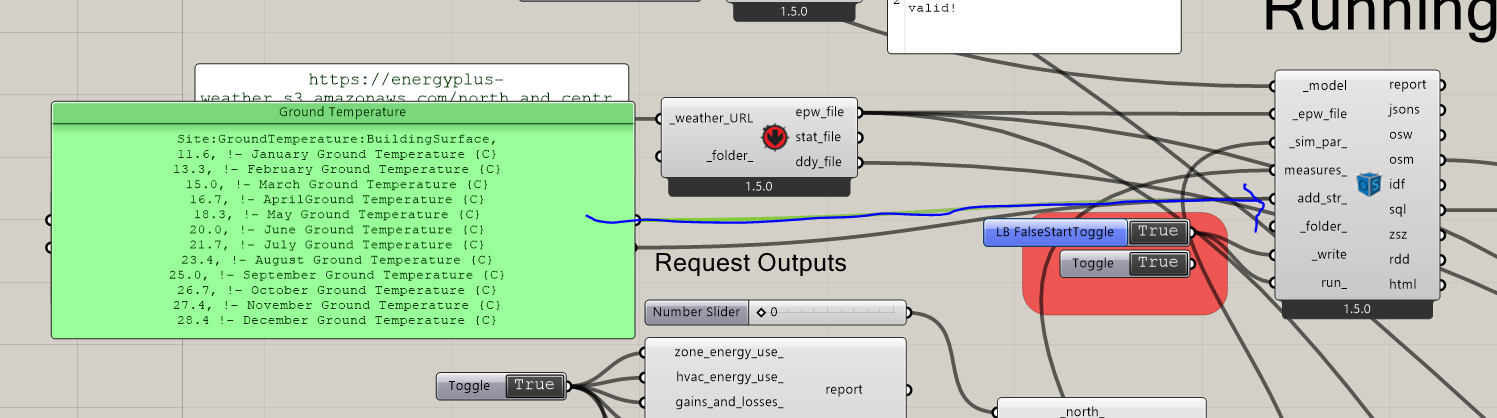
Ground temperatures from the epw look like this

Modelling ground conditions accurately, and accurately modelling U-values of constructions that touch ground, is something I’ve struggled with and don’t have a good answer on. From my limited knowledge I would either set a varying ground condition, or I would set the ground adjacency to air and apply some degree of U-value adjustment to account for the ground providing some extra degree of insulation

Sorry there’s not a simpler answer!

1 Like

Hello Charlie!

Thanks for the prompt response. I am almost able to follow all you said, but I have a few tiny questions:

I wonder why did you say ‘this cooling makes sense’ in the mean temp chart. what is ‘this’?

Also, how did you get the ground temp in the chart?

Hi @Yure,

Sorry that was a bit unclear - by “this cooling makes sense” I meant the heat transfer from the space through the floor as it’s a heat loss to the space.

For the ground temperatures I used “Import EPW” and plugged the ground temperature output into a monthly chart. I’m not sure if it’s possible to apply these ground temperatures as an adjacent condition…

Chris talks a bit about setting boundary conditions here and it looks like the capability has now been included on the code side, but there might not be a component included yet that includes that functionality - if you took that approach you might need to look into using the python SDK

Thanks again Charlie. How would you set up a varying ground condition? I researched and did this (look snip below), and ran the simulation again and nothing changed.

I also tried to assign ‘ground’ to the floor face, but I haven’t been successful at that either. it seems that when I try to do that, then I get 3 faces from ‘exterior floor’ which confused me. see below.